|
AIR QUALITY MATTERS |
|
Borough of Brent |
|
|
|
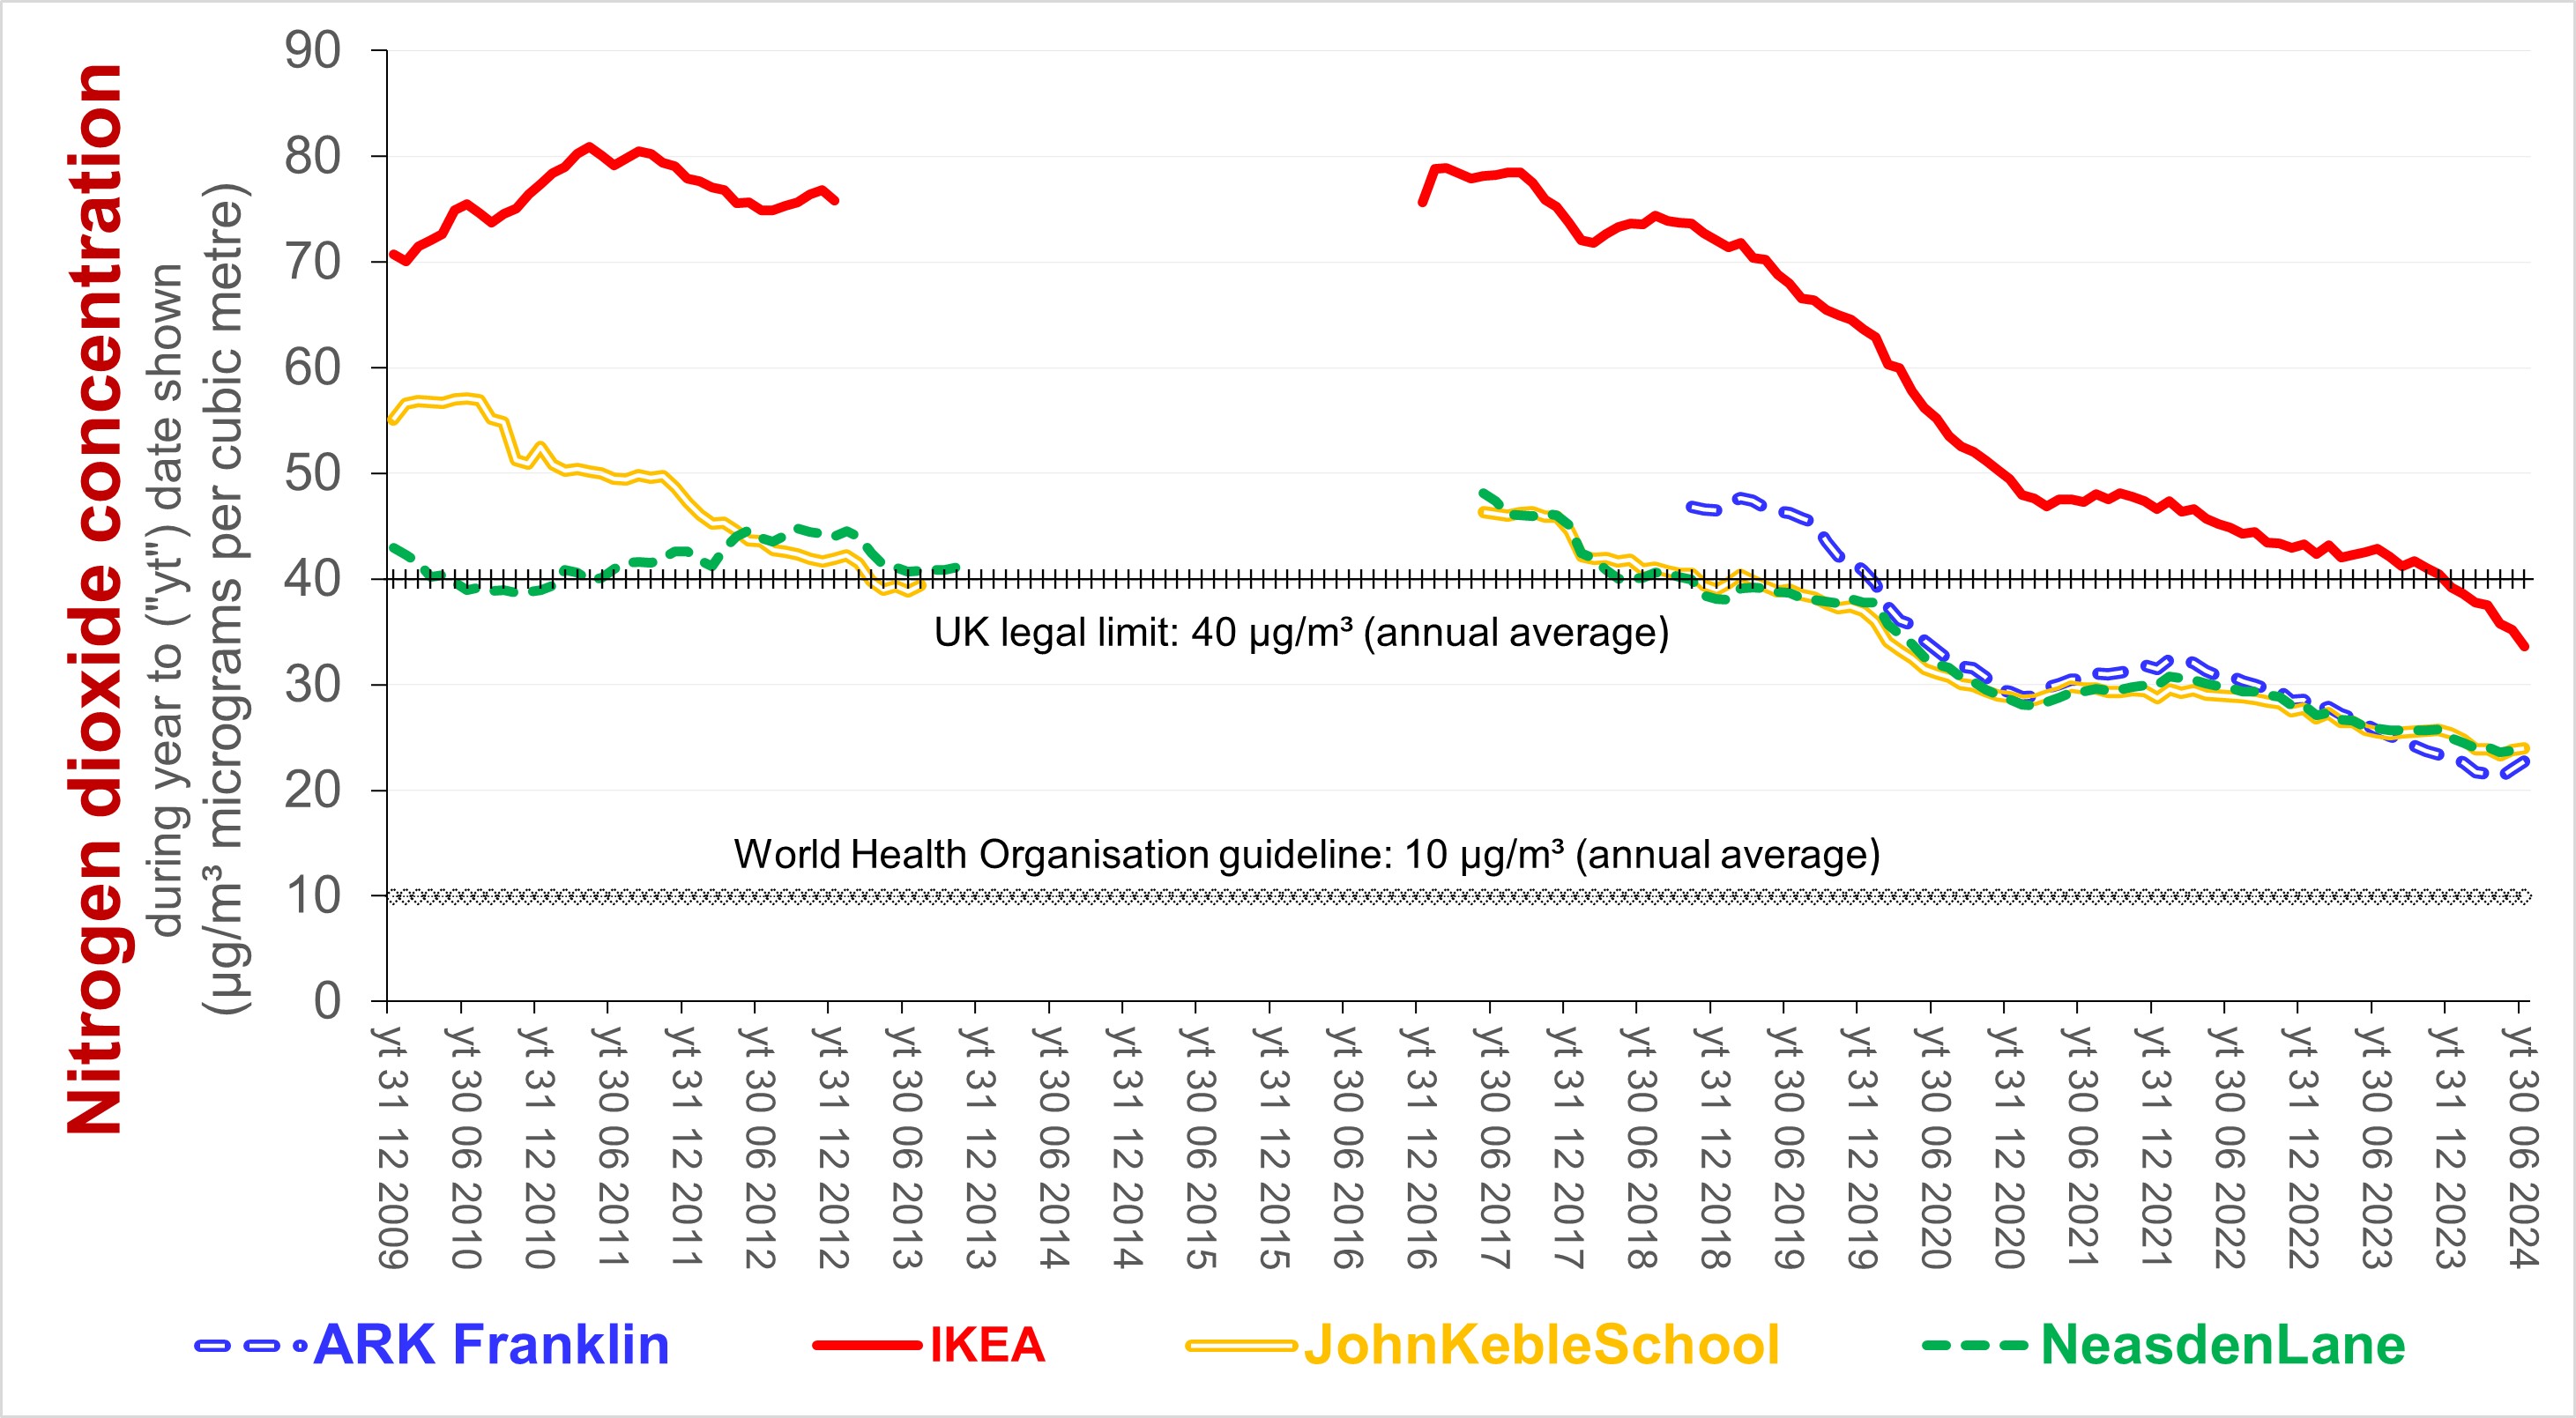
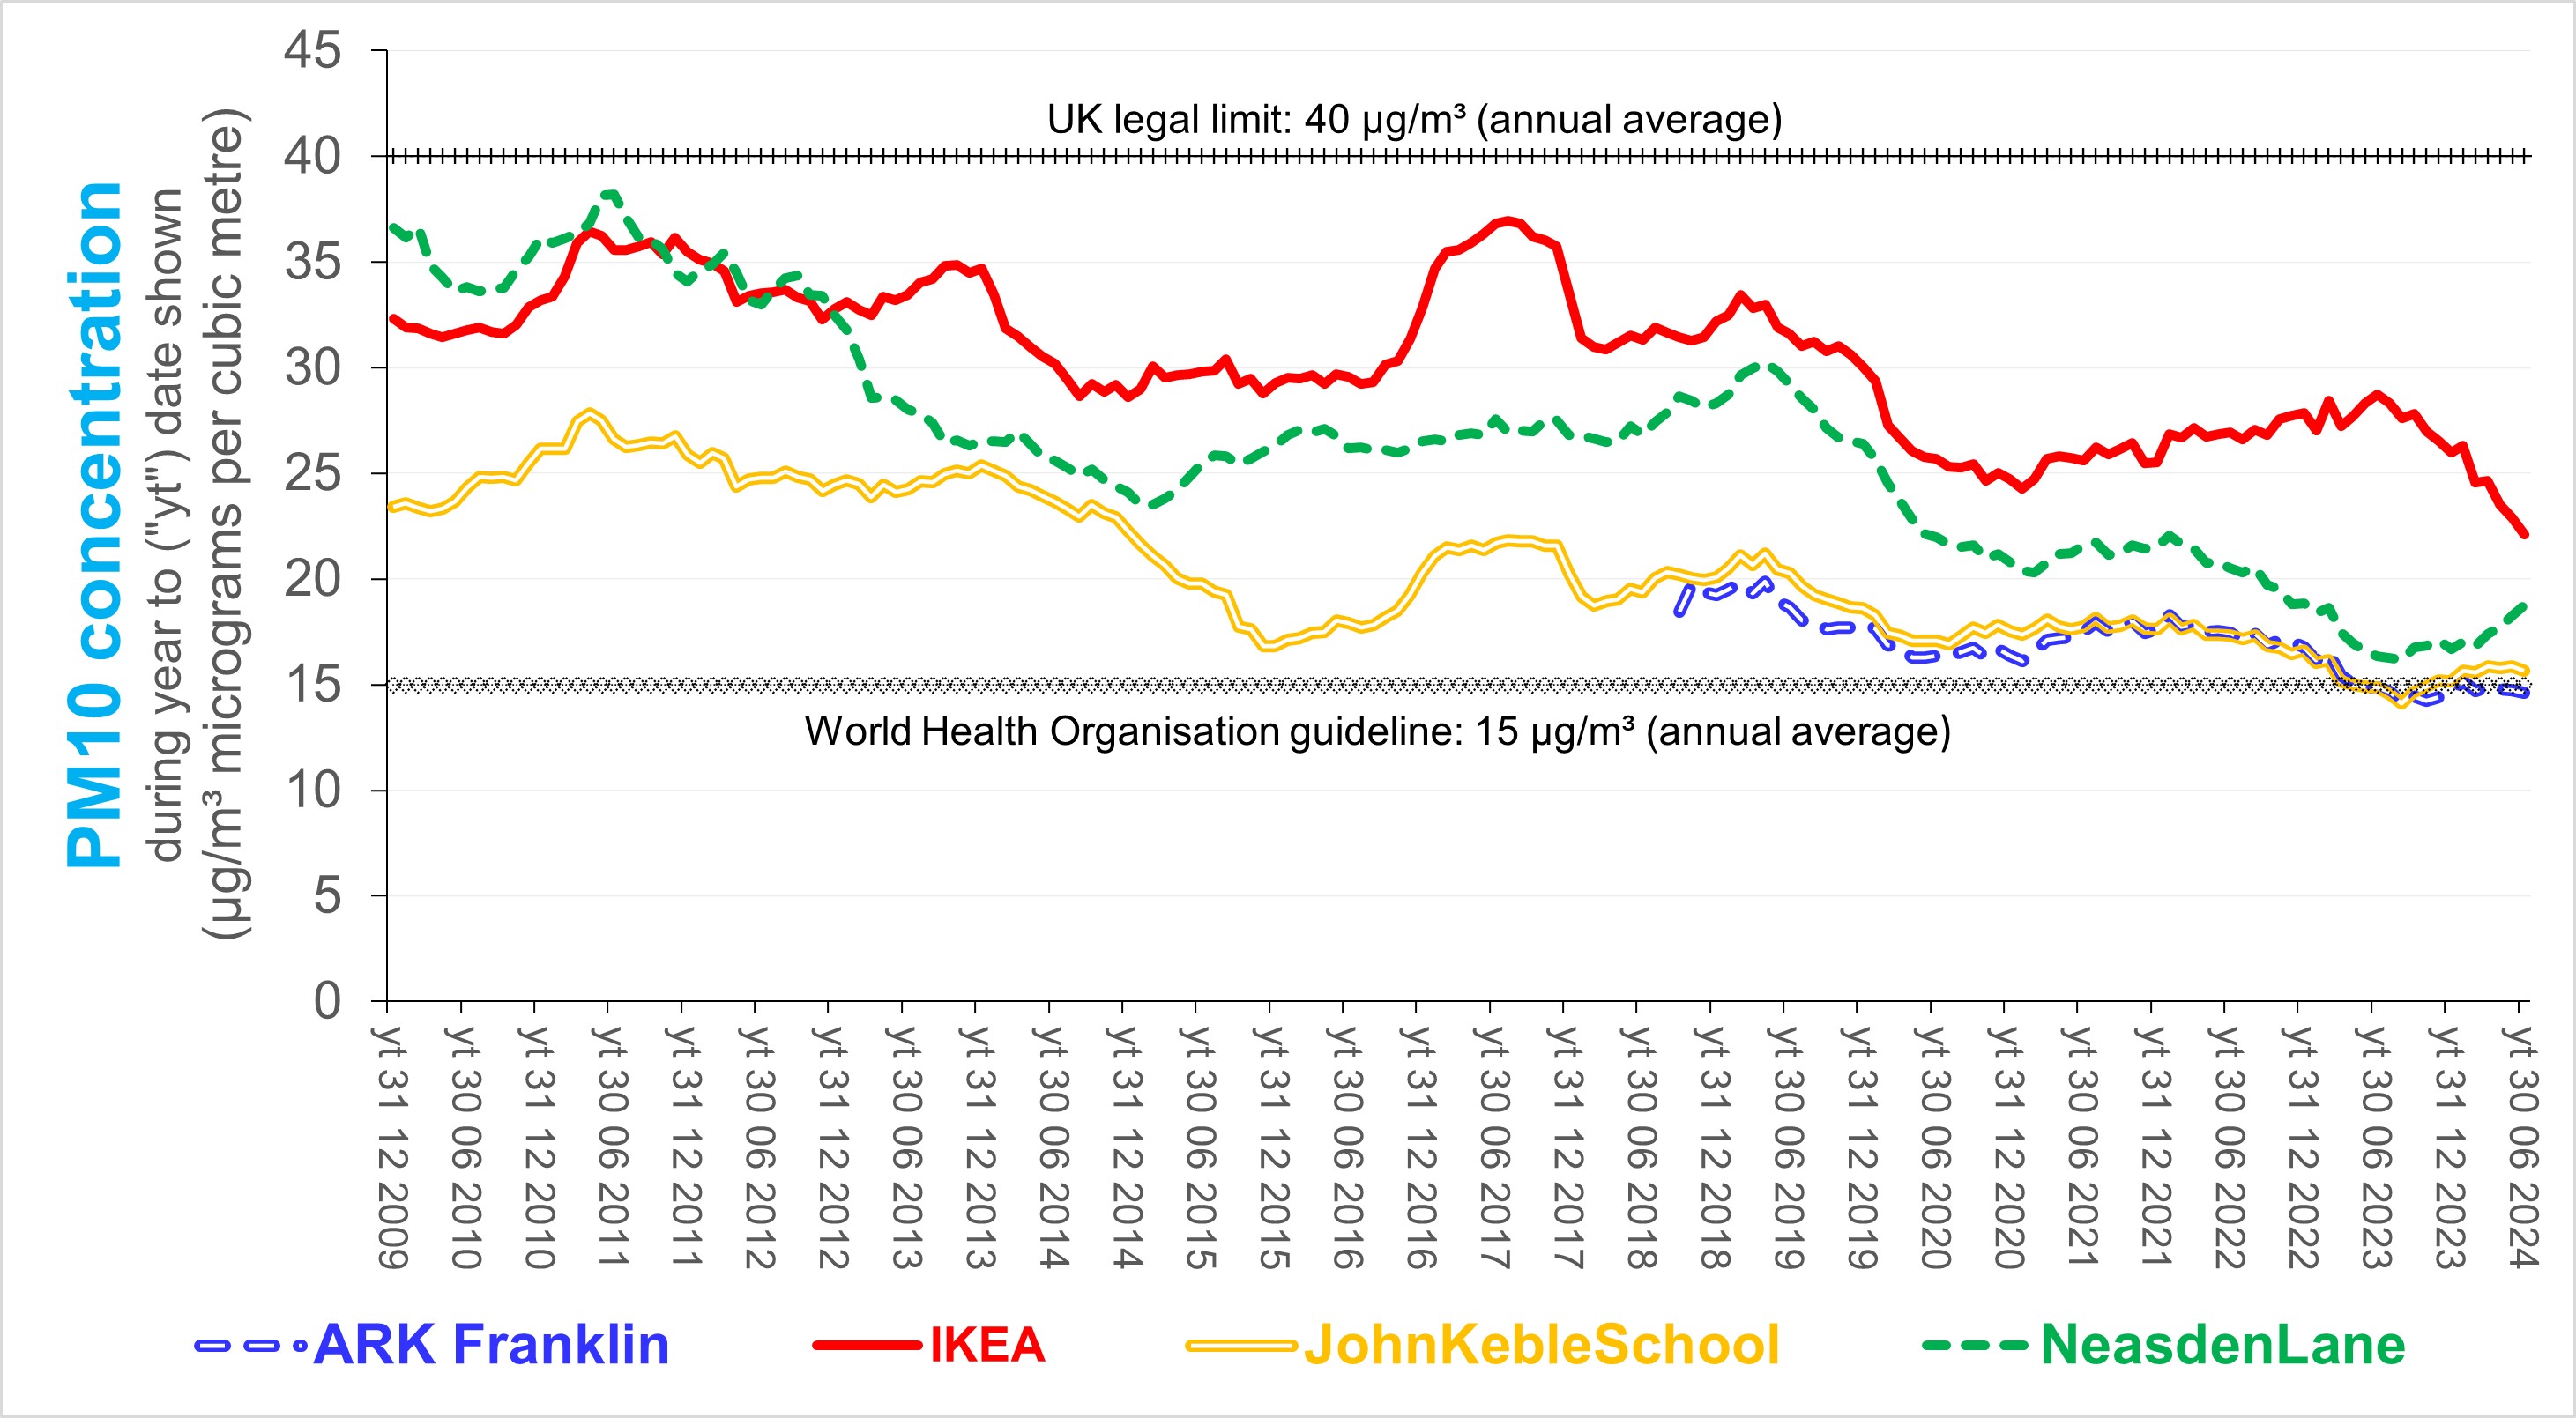
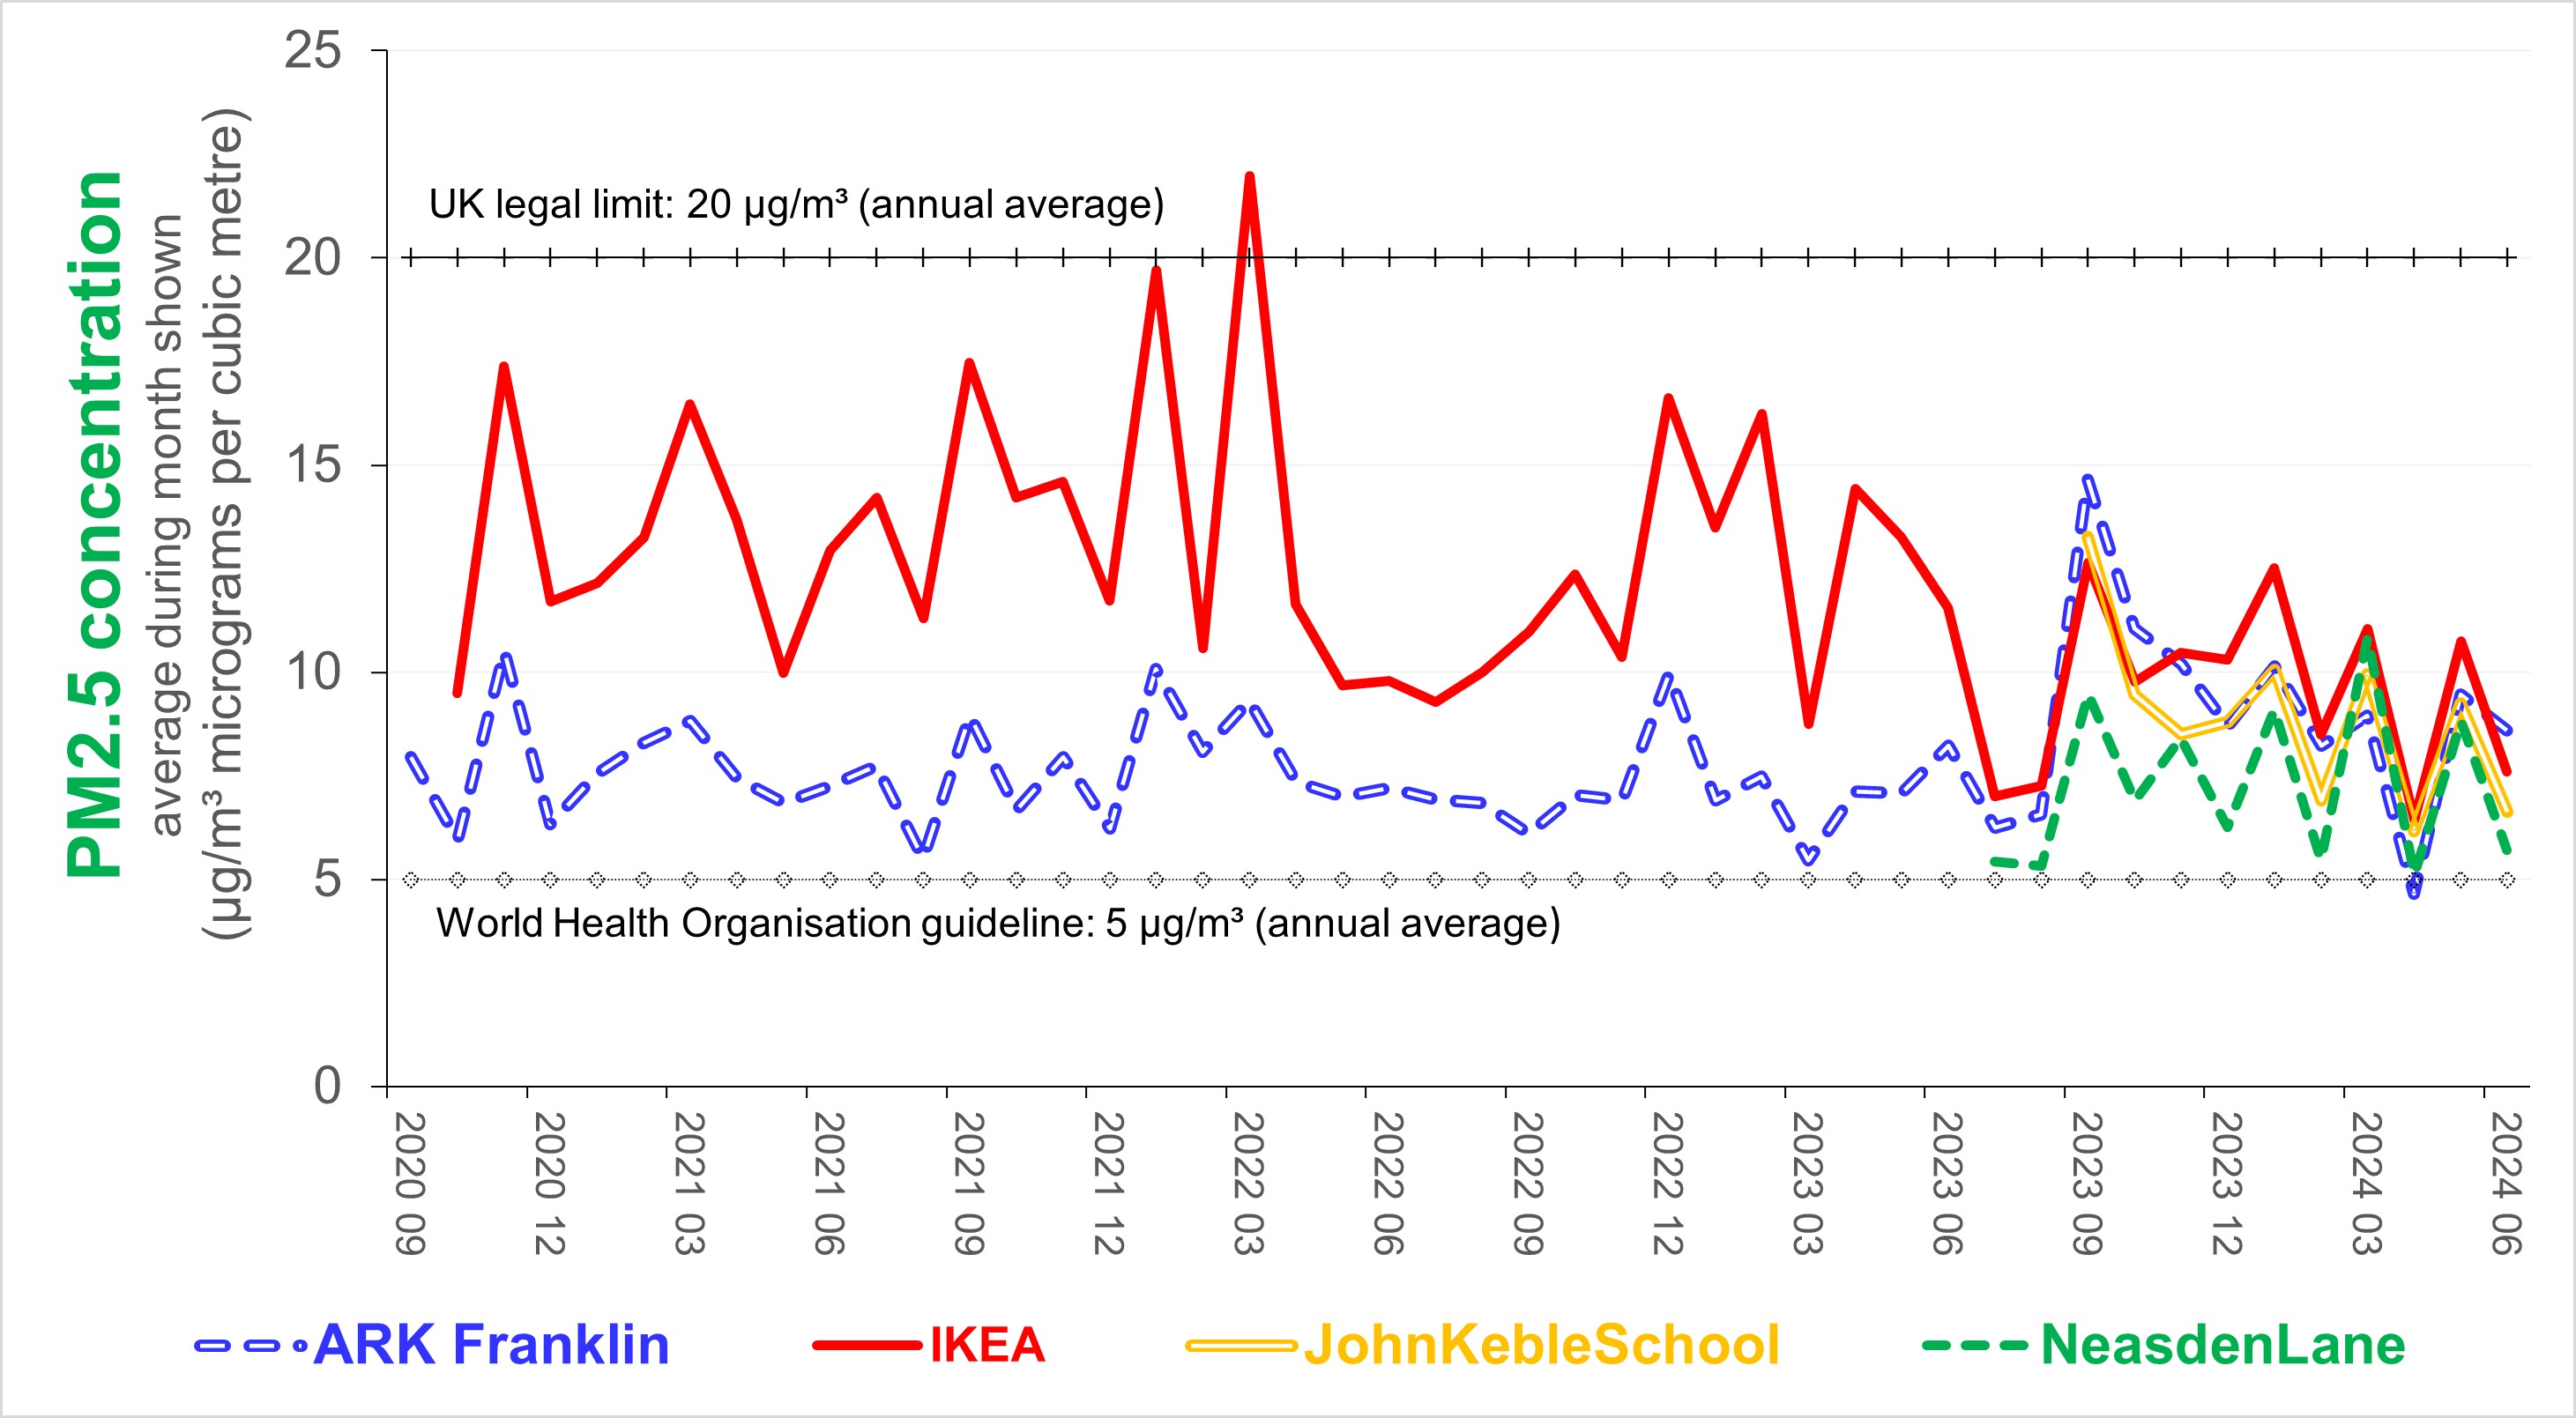
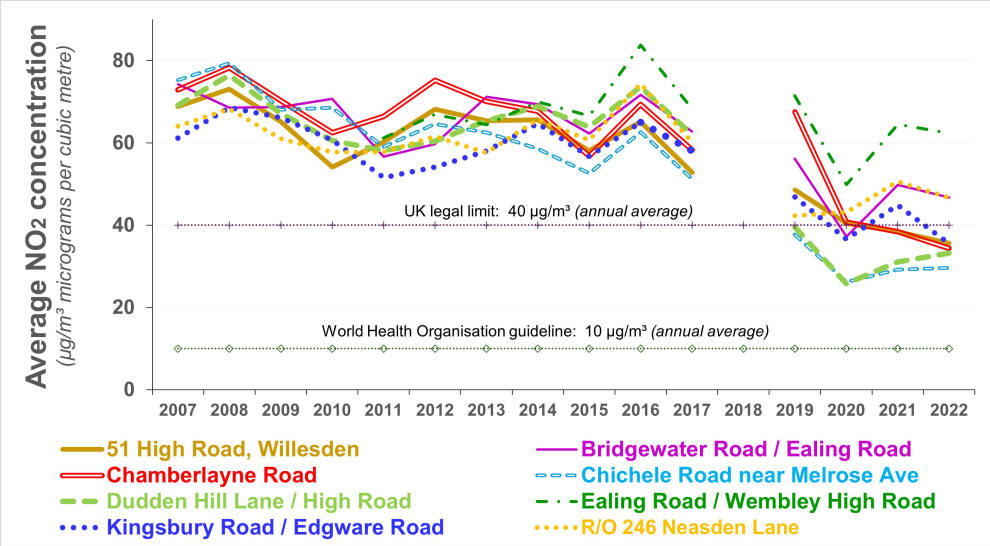
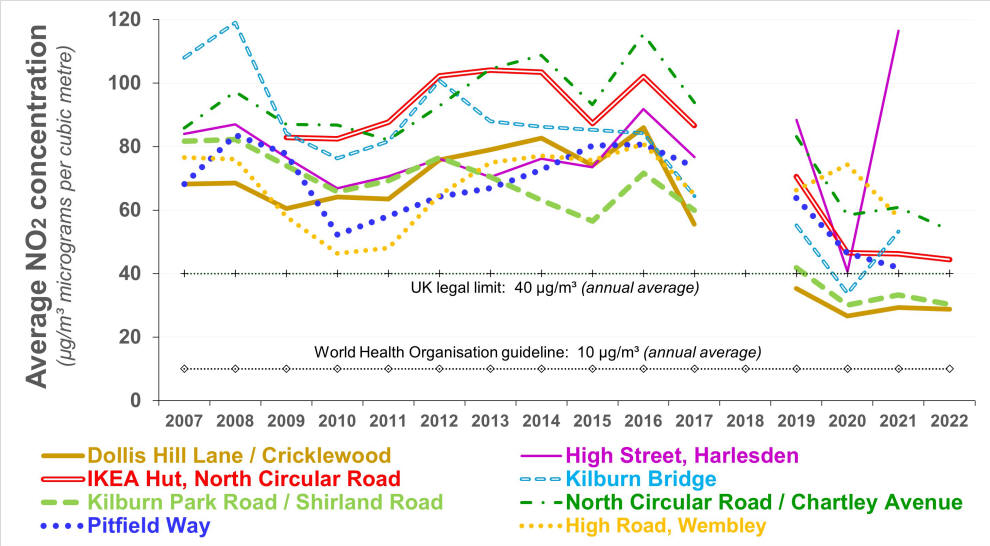
The following thee charts show how the annual average
concentration of NO2,
PM10 and PM2.5 have changed since 2009 at AURN reference stations
in the Borough of Brent. The current trend in NO2 is unclear but
probably downwards. That for PM10 is unclear. For
PM2.5 it is upwards (caused by what - factors in Brent? in London?
outside UK? climate change?). If the number (also shape and
chemical composition) of particles per unit of volume determines
health impact, then trends in weight per unit of volume might be
misleading.
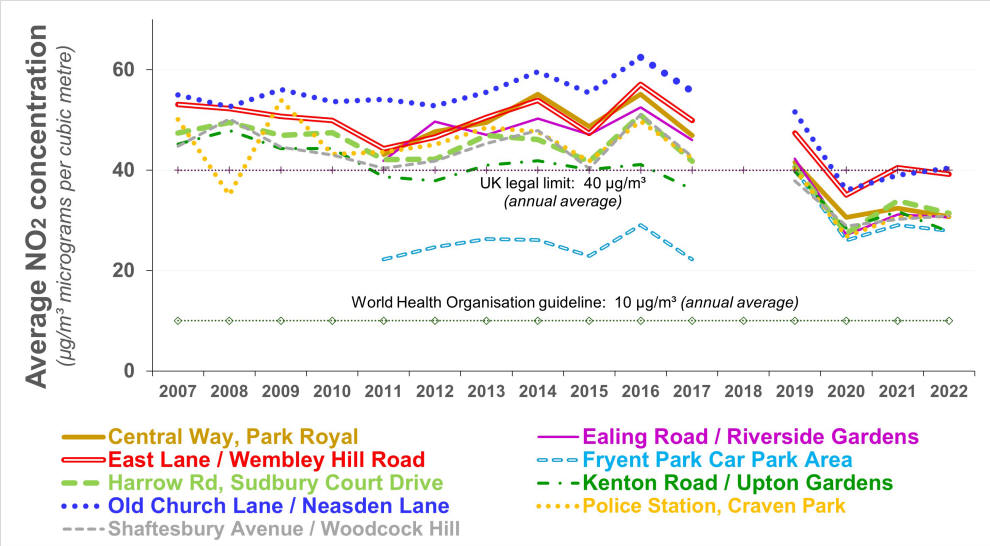
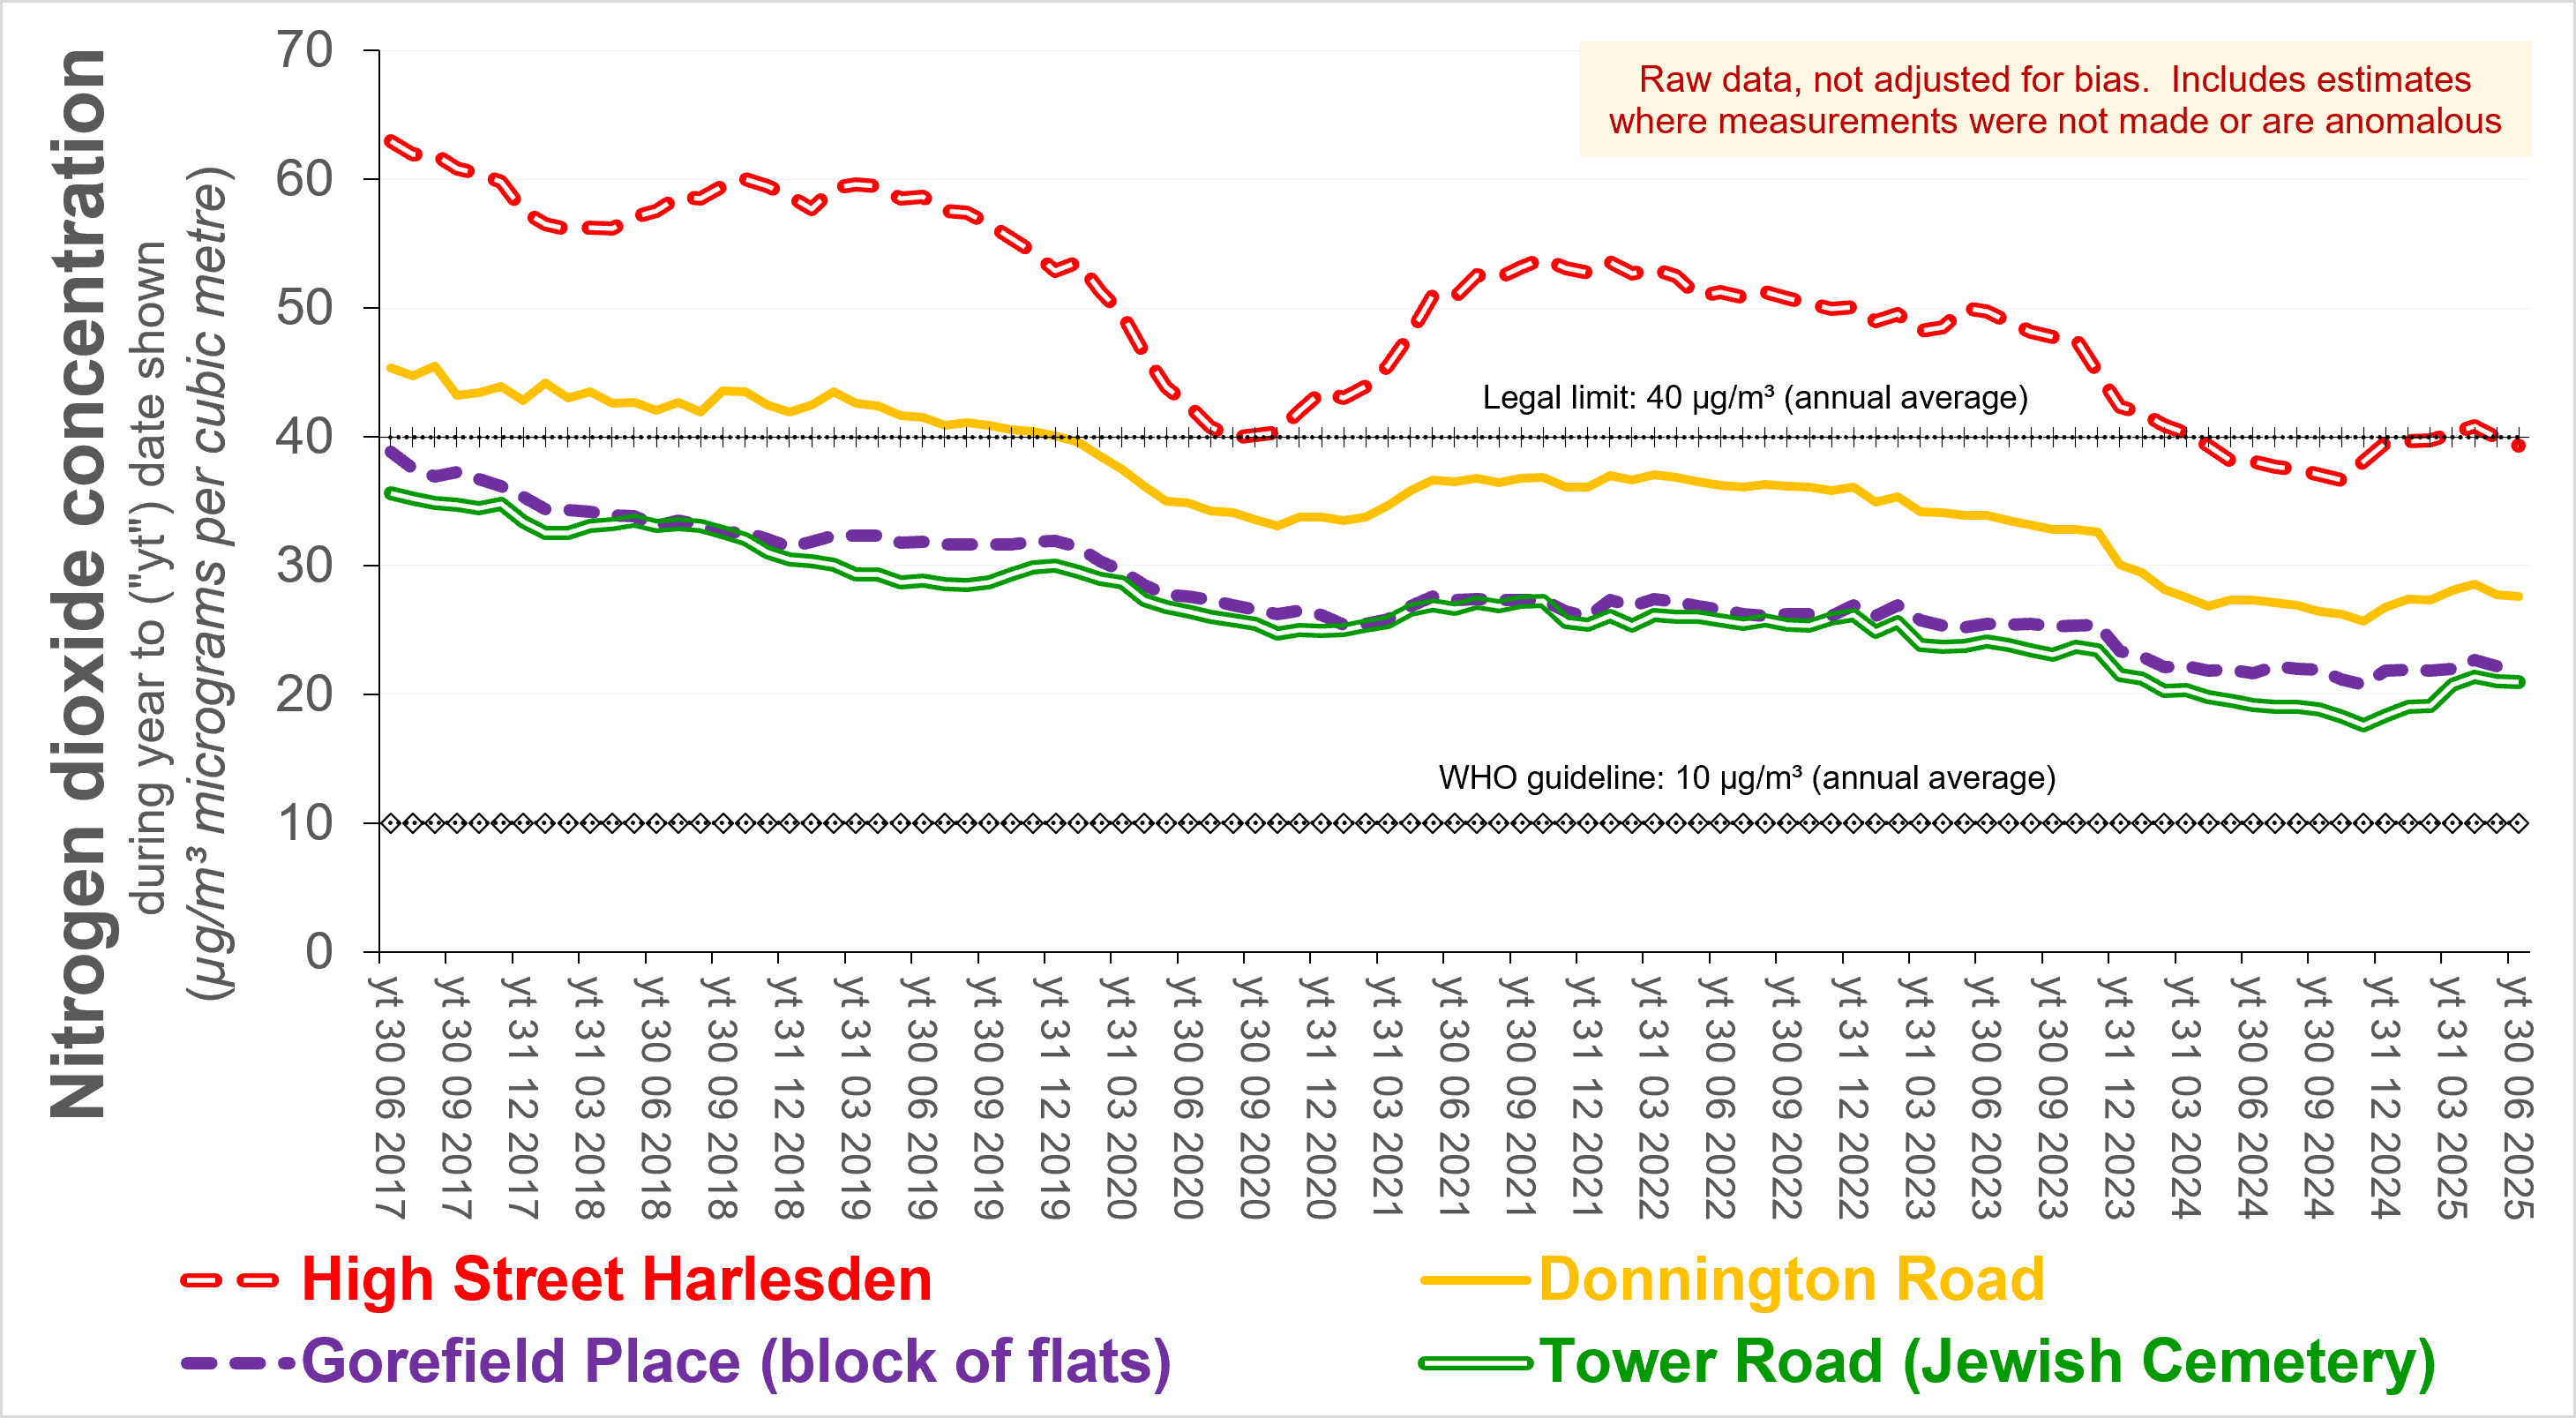
The
following three charts illustrate trends in average annual
concentrations of NO2 - "ratified and bias-adjusted" - as measured
using diffusion tubes around the
borough. The 50% improvement since 2017 is presumably at
least partly attributable to the ULEZ.
Source:
based on
Borough of
Brent
Trends in NO2 concentration
measured by
HS2 using diffusion tubes are shown below.
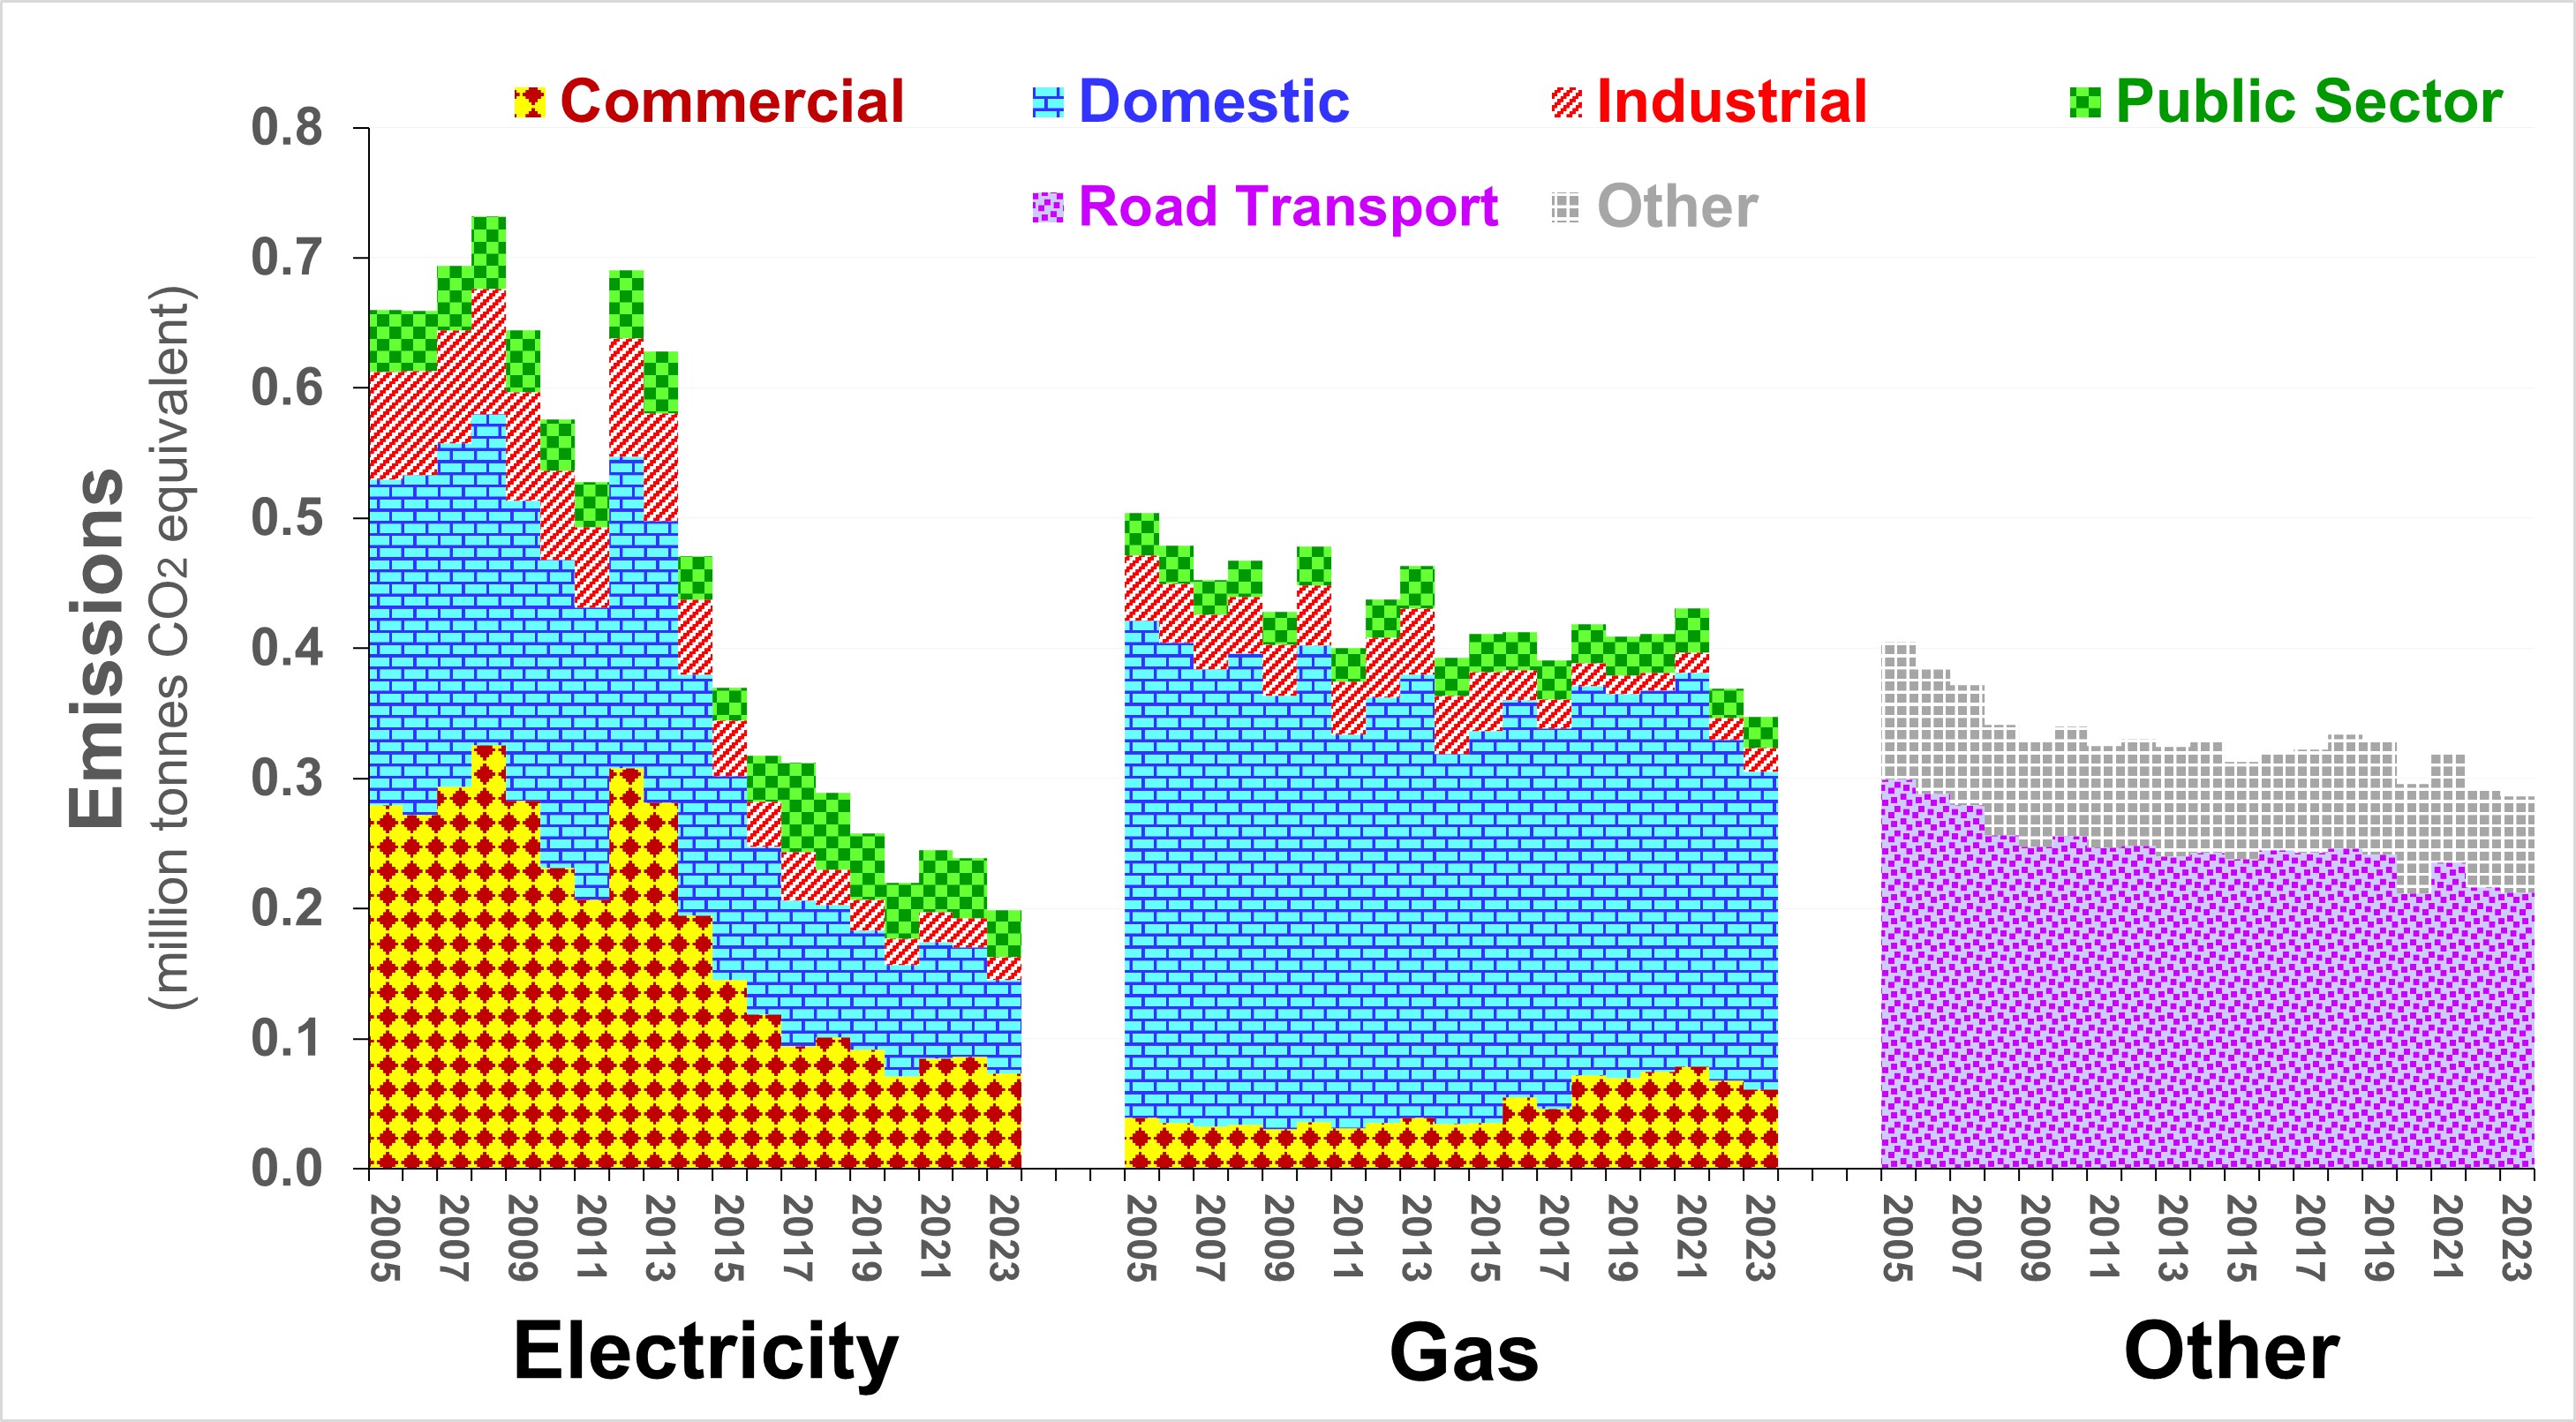
The following chart indiates that, since
Brent, the GLA and UK recognised the Climate Emergency,
borough-wide progress towards decarbonisation lags far behind the
(more than) 10% each year which is now imperative.
Borough-wide emissions during 2024 or 2025 are unlikely to be
lower than they were during the 2022/2023 energy crisis. The
global carbon budget for "well below 2C" is likely to be exhausted
before 2050 - even sooner for the UK's share (necesarily
apportioned according to the country's legacy and wealth) of this.
Source: based on
DEFRA
|
|
For further information, please contact: info@airqualitymatters.uk |
| Back |