|
AIR QUALITY MATTERS |
|
Borough of Camden |
|
|
|
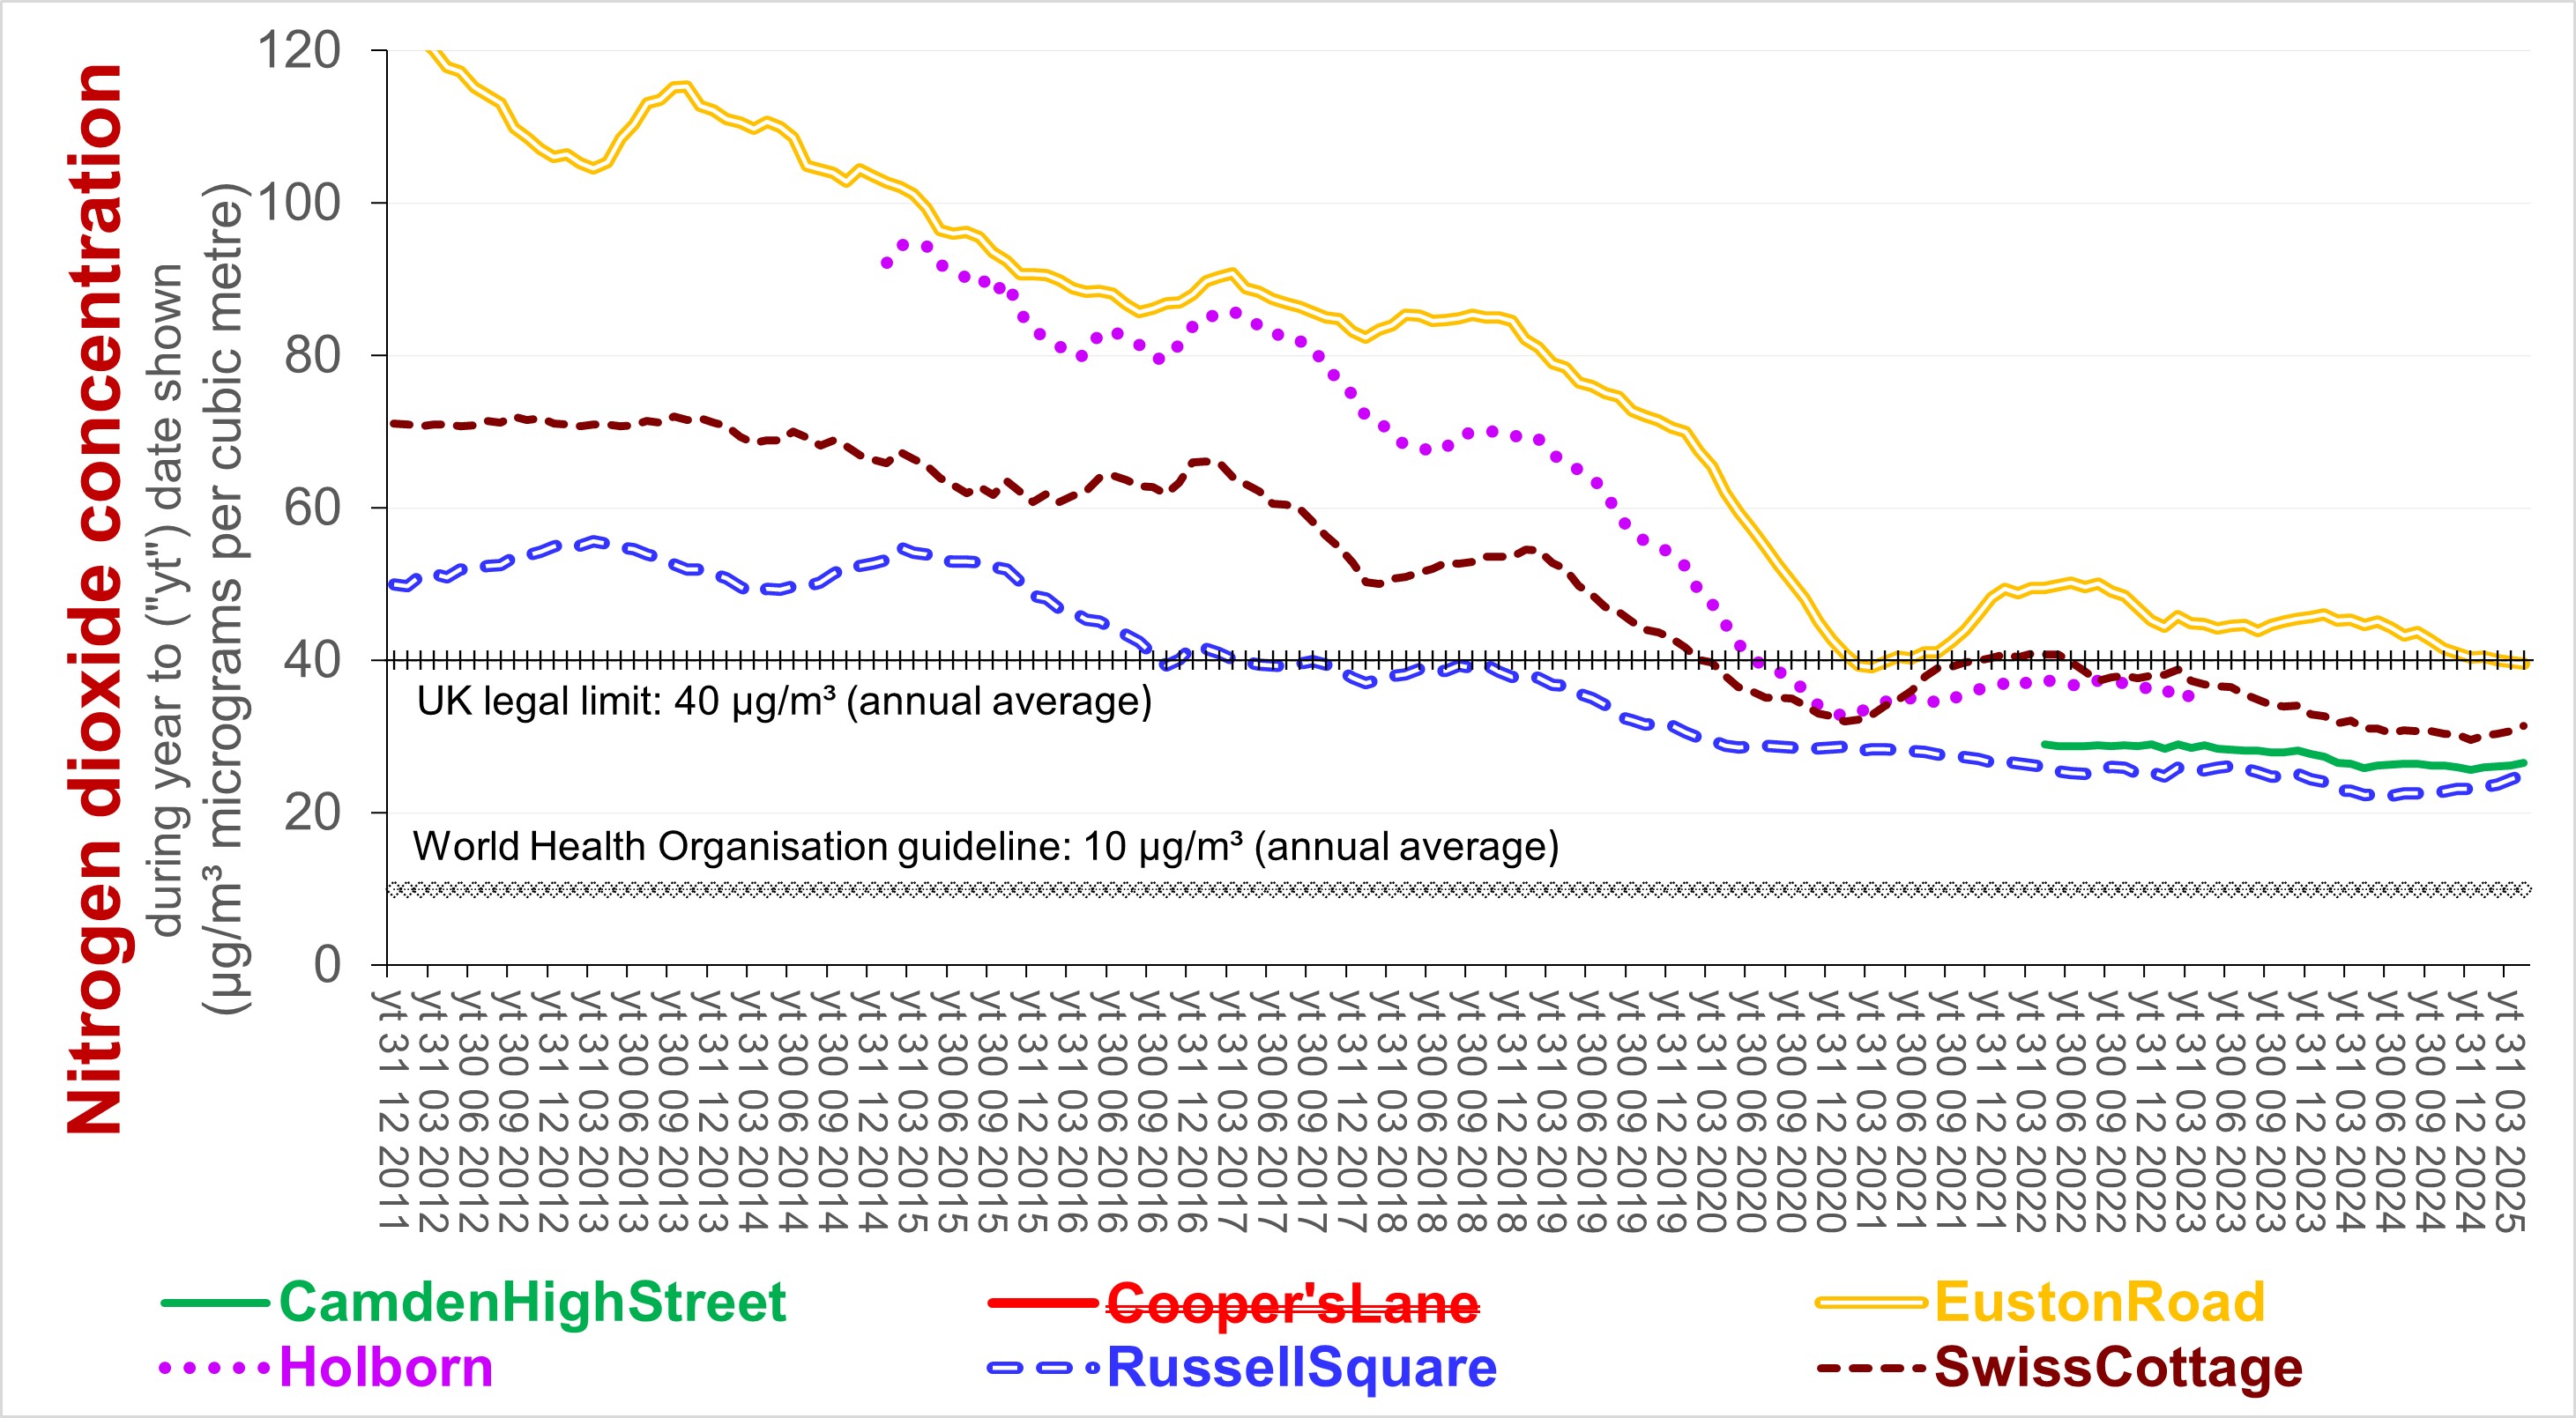
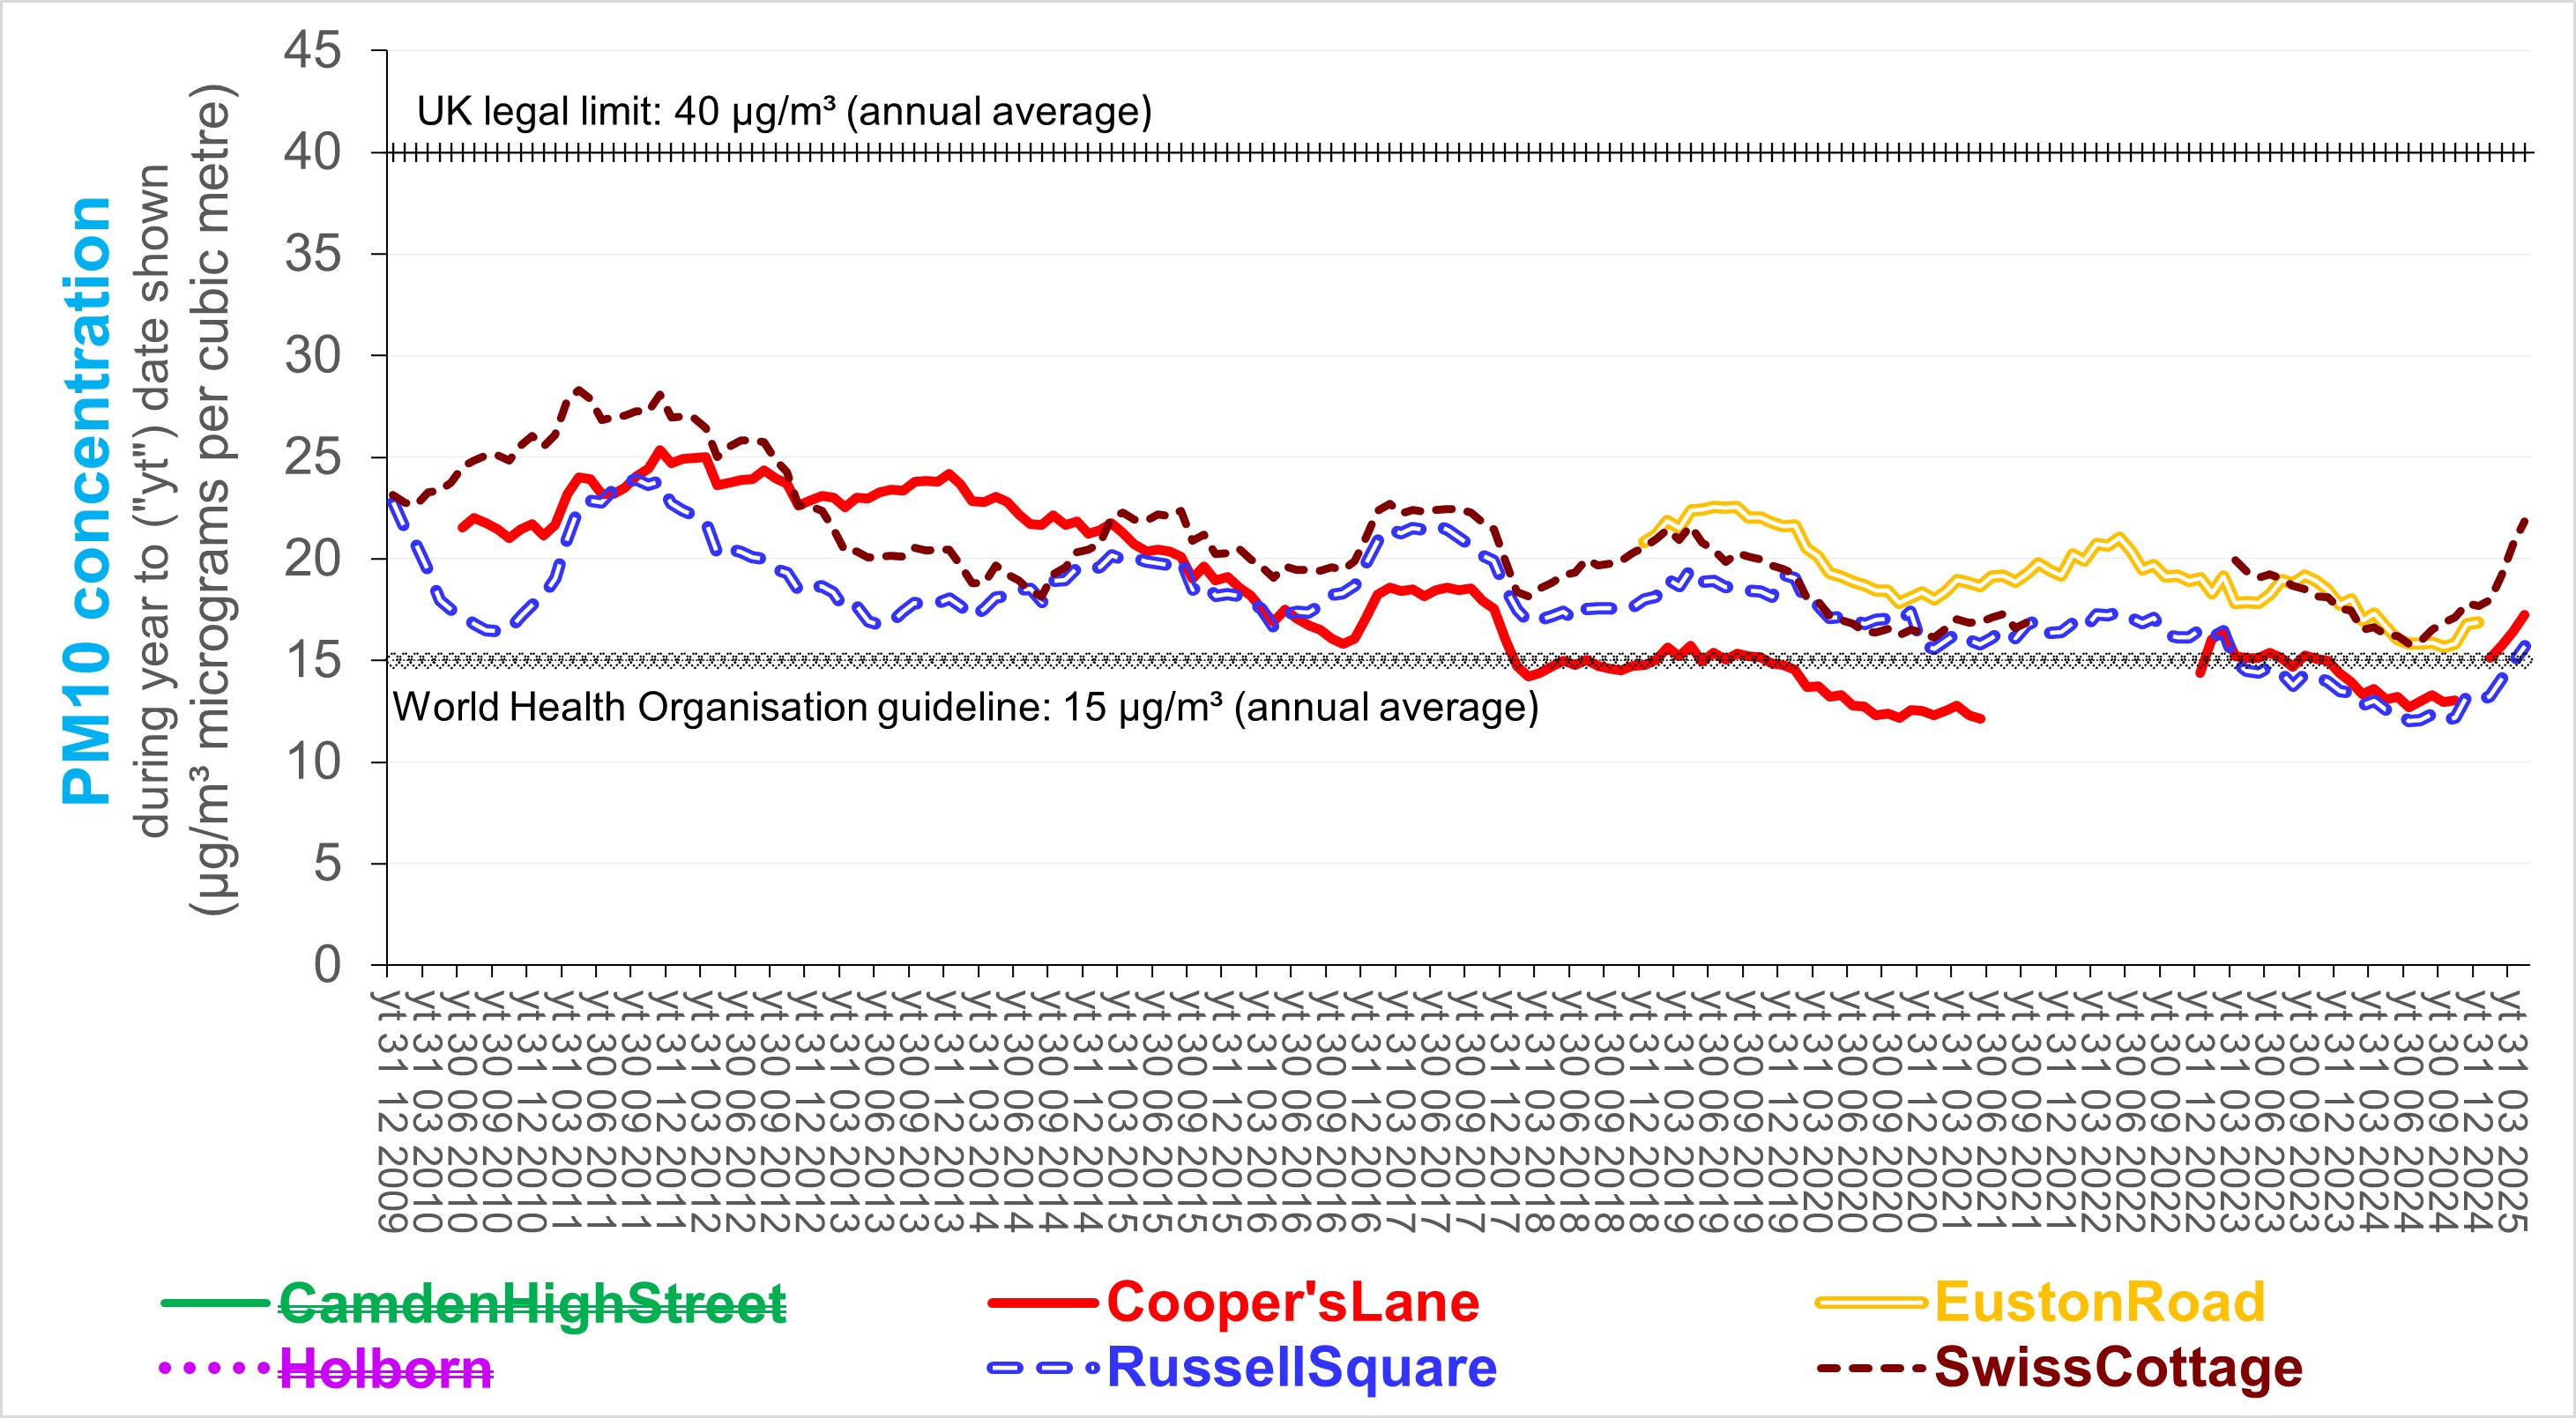
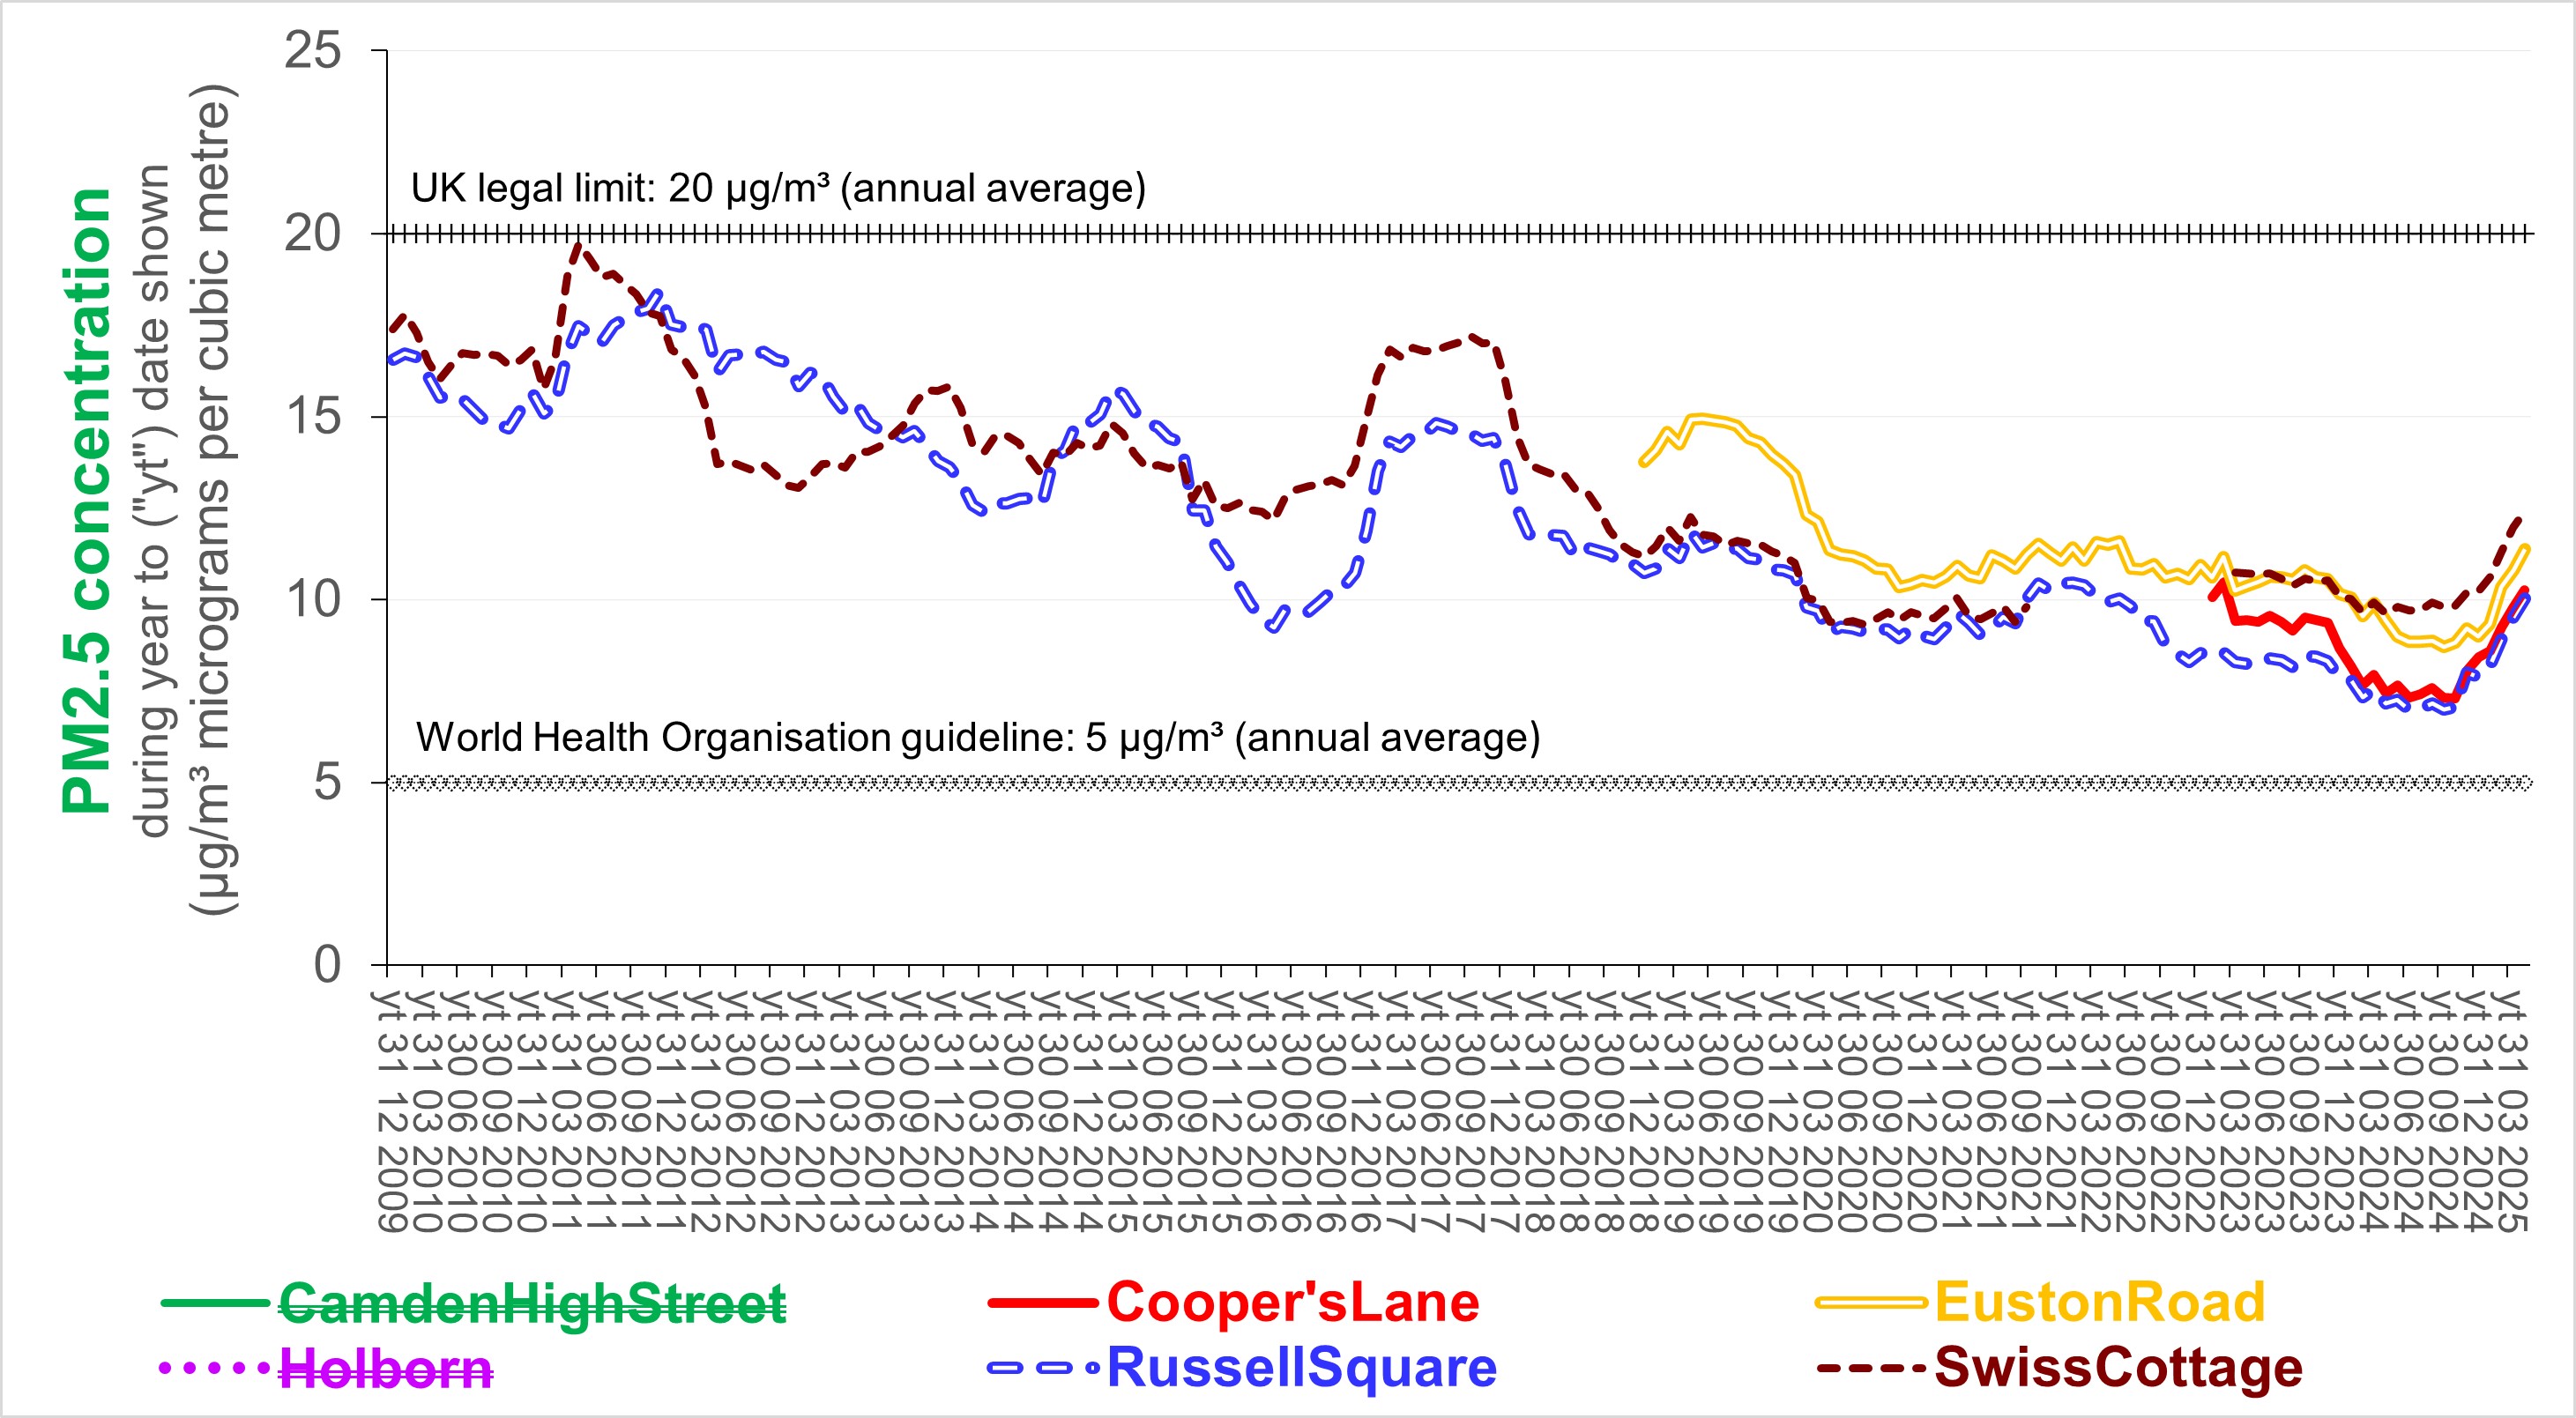
The following charts illustrate trends in the annual average concentration of NO2, PM10 and PM2.5 as recorded in Camden by reference quality monitors.
The charts above indicate that air quality along the Euston Road is at or well below the UK legal limit for the three pollutants. This might come as a surprise to those who would prefer that the cycle lane is removed.
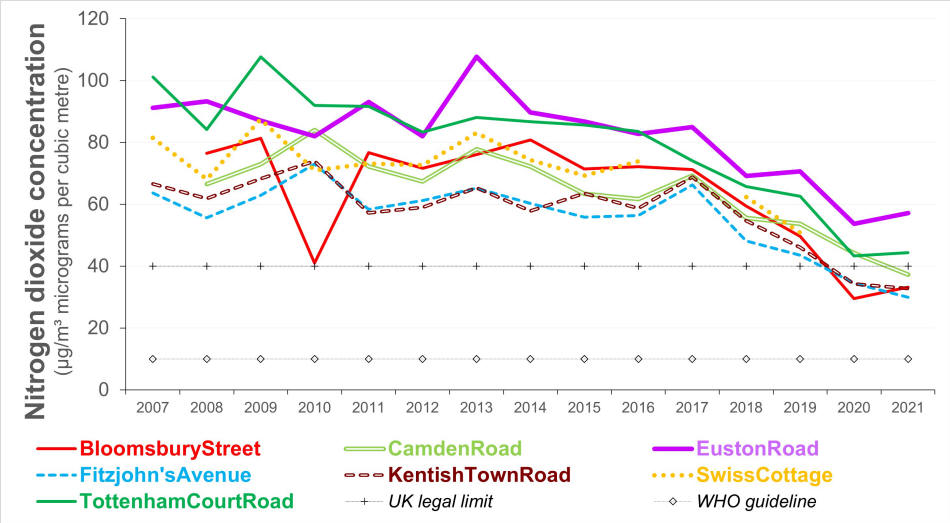
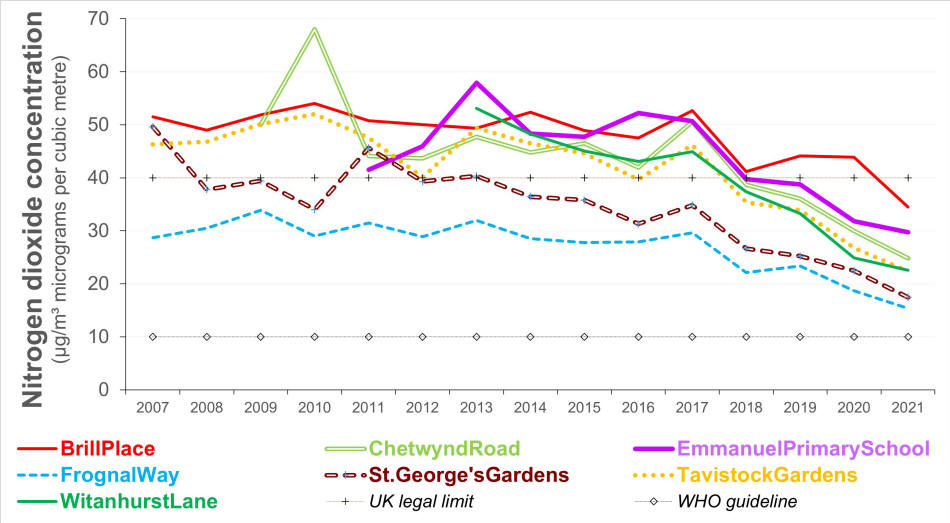
The following pair of charts illustrate
trends in the annual concentration of NO2
measured by diffusion tube as reported in Council's Air Quality
Annual Status Reports.
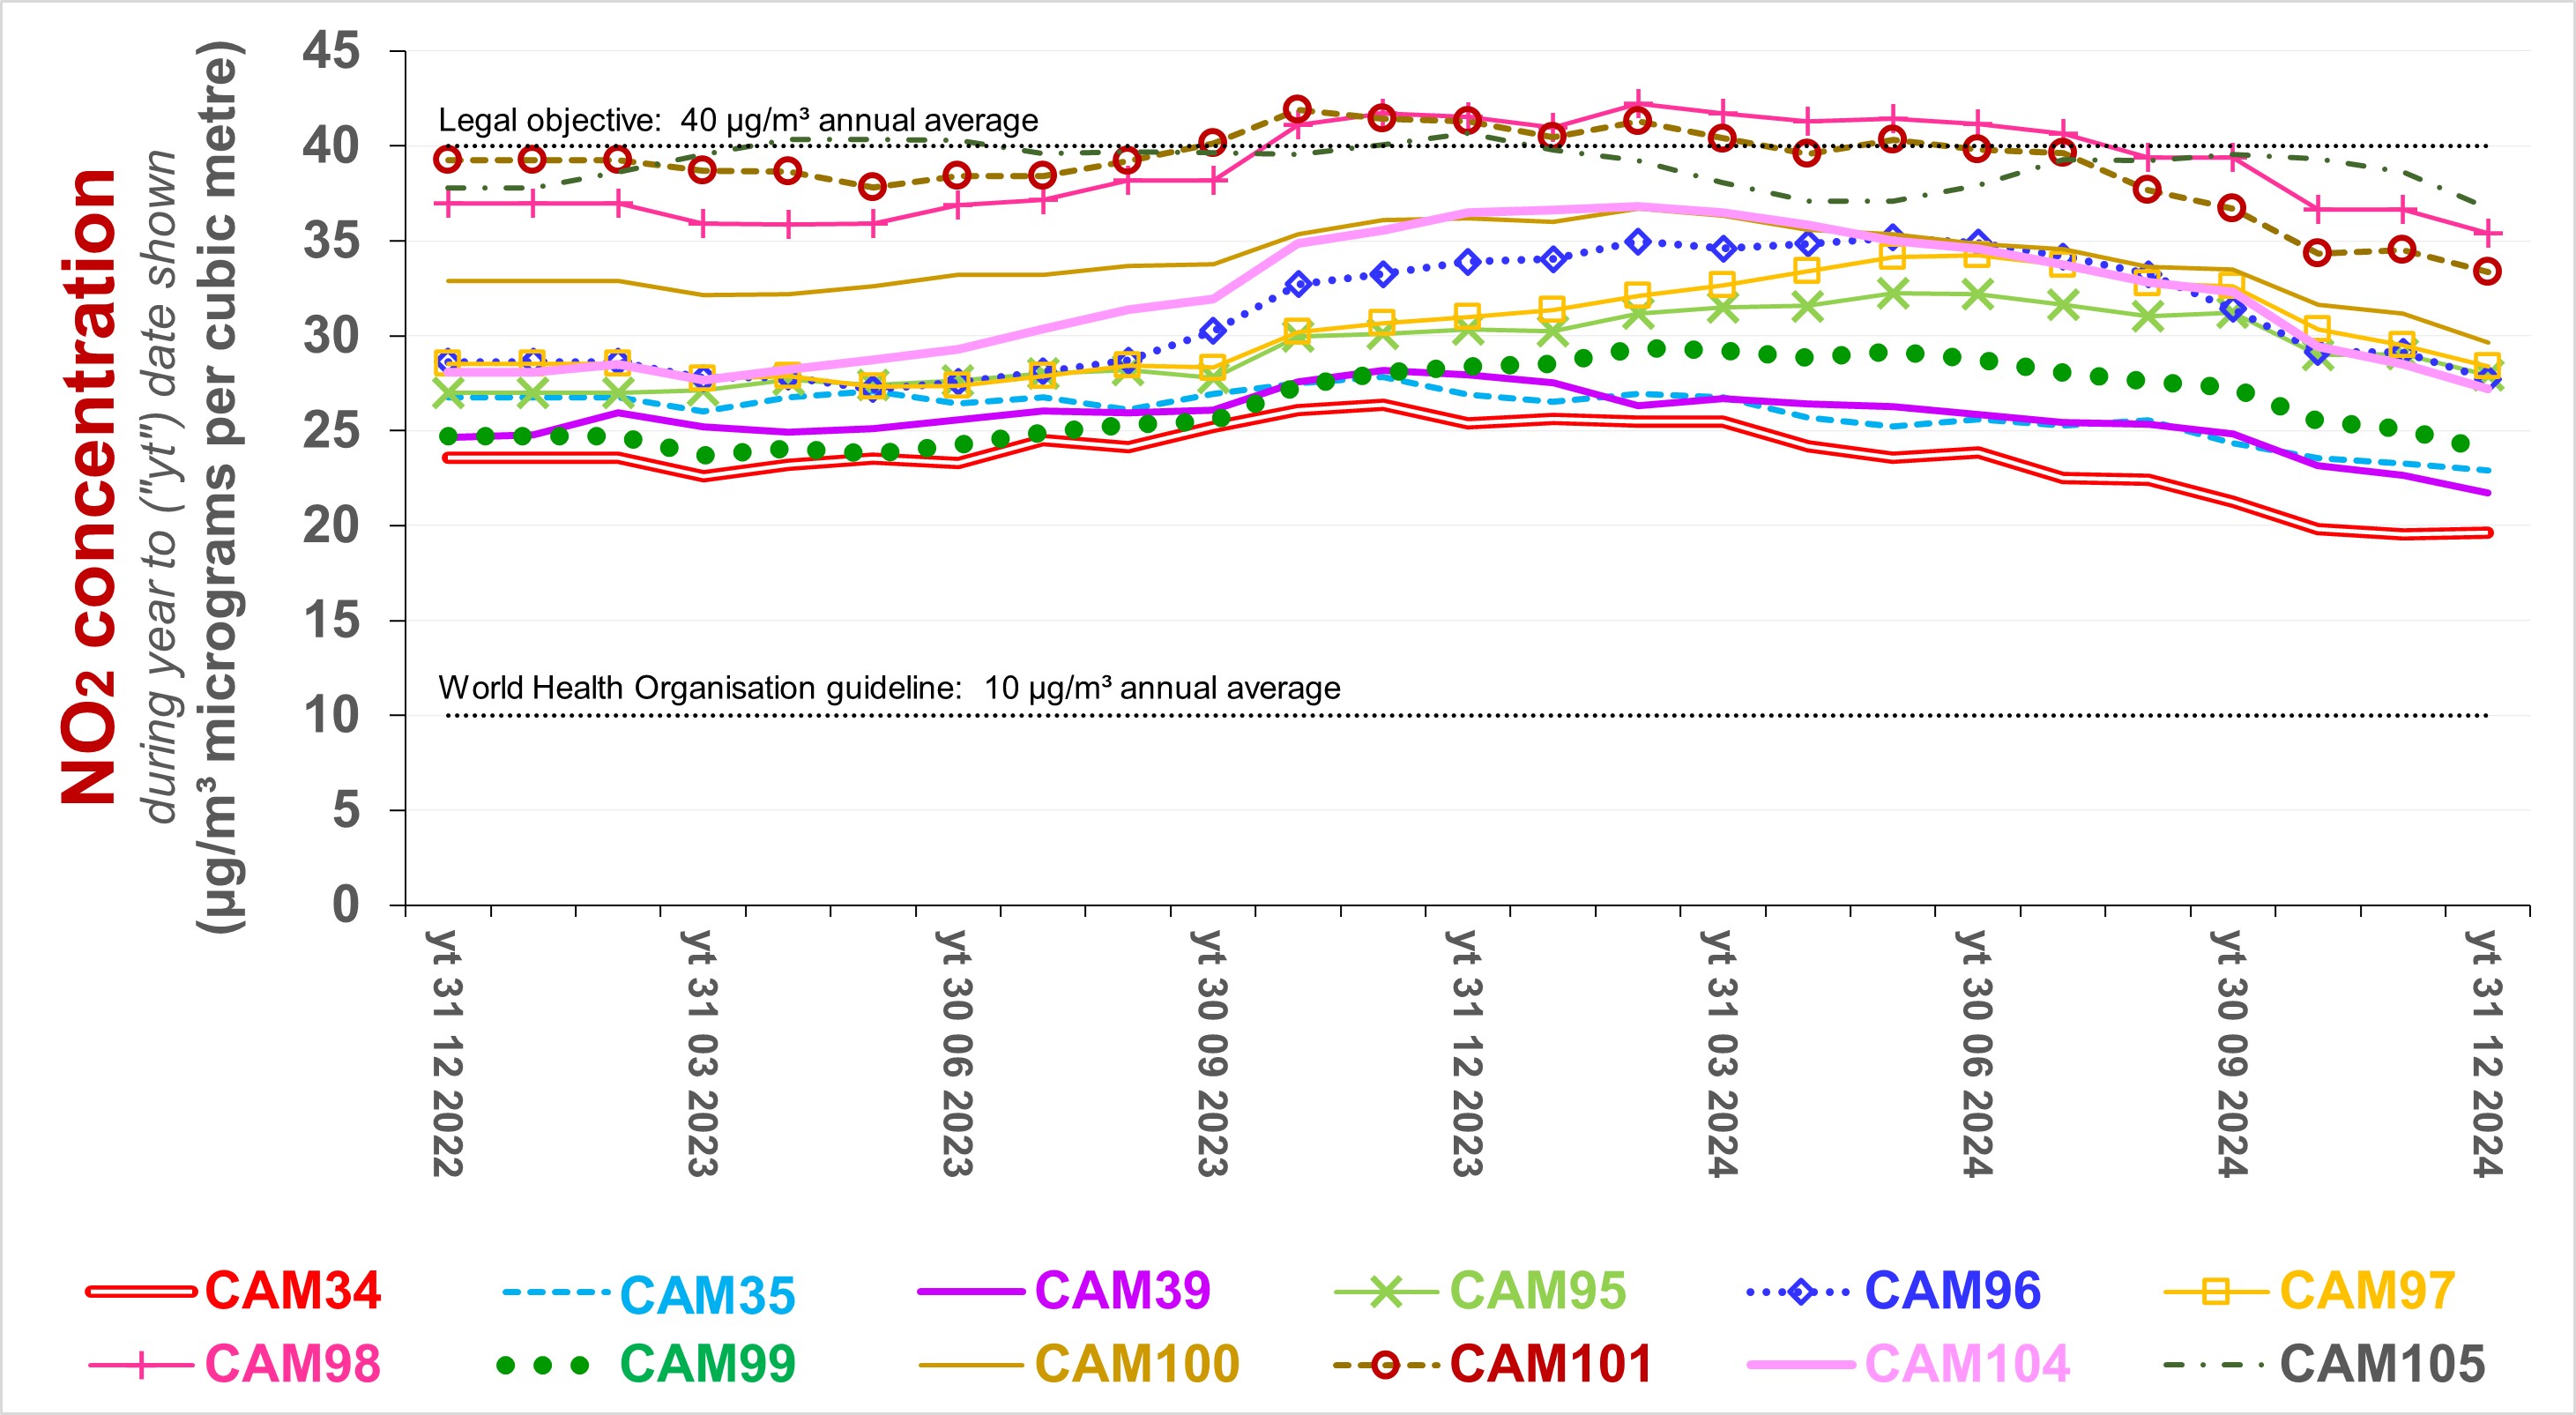
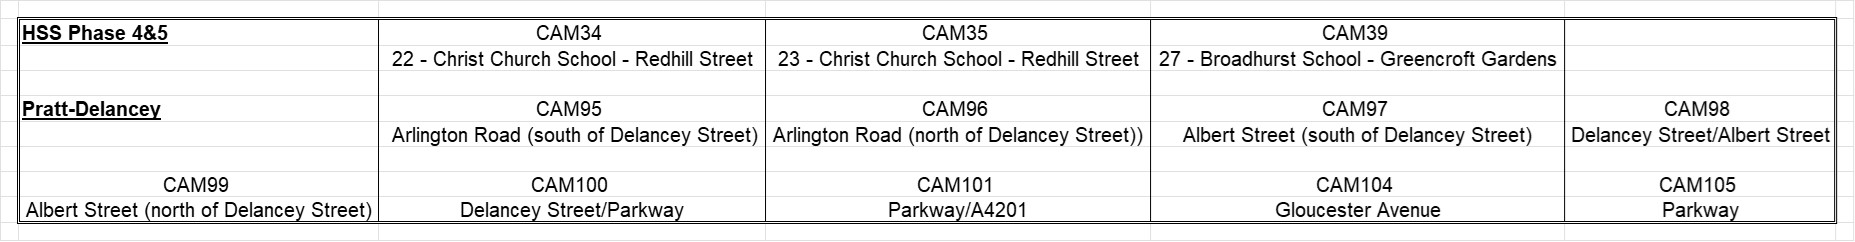
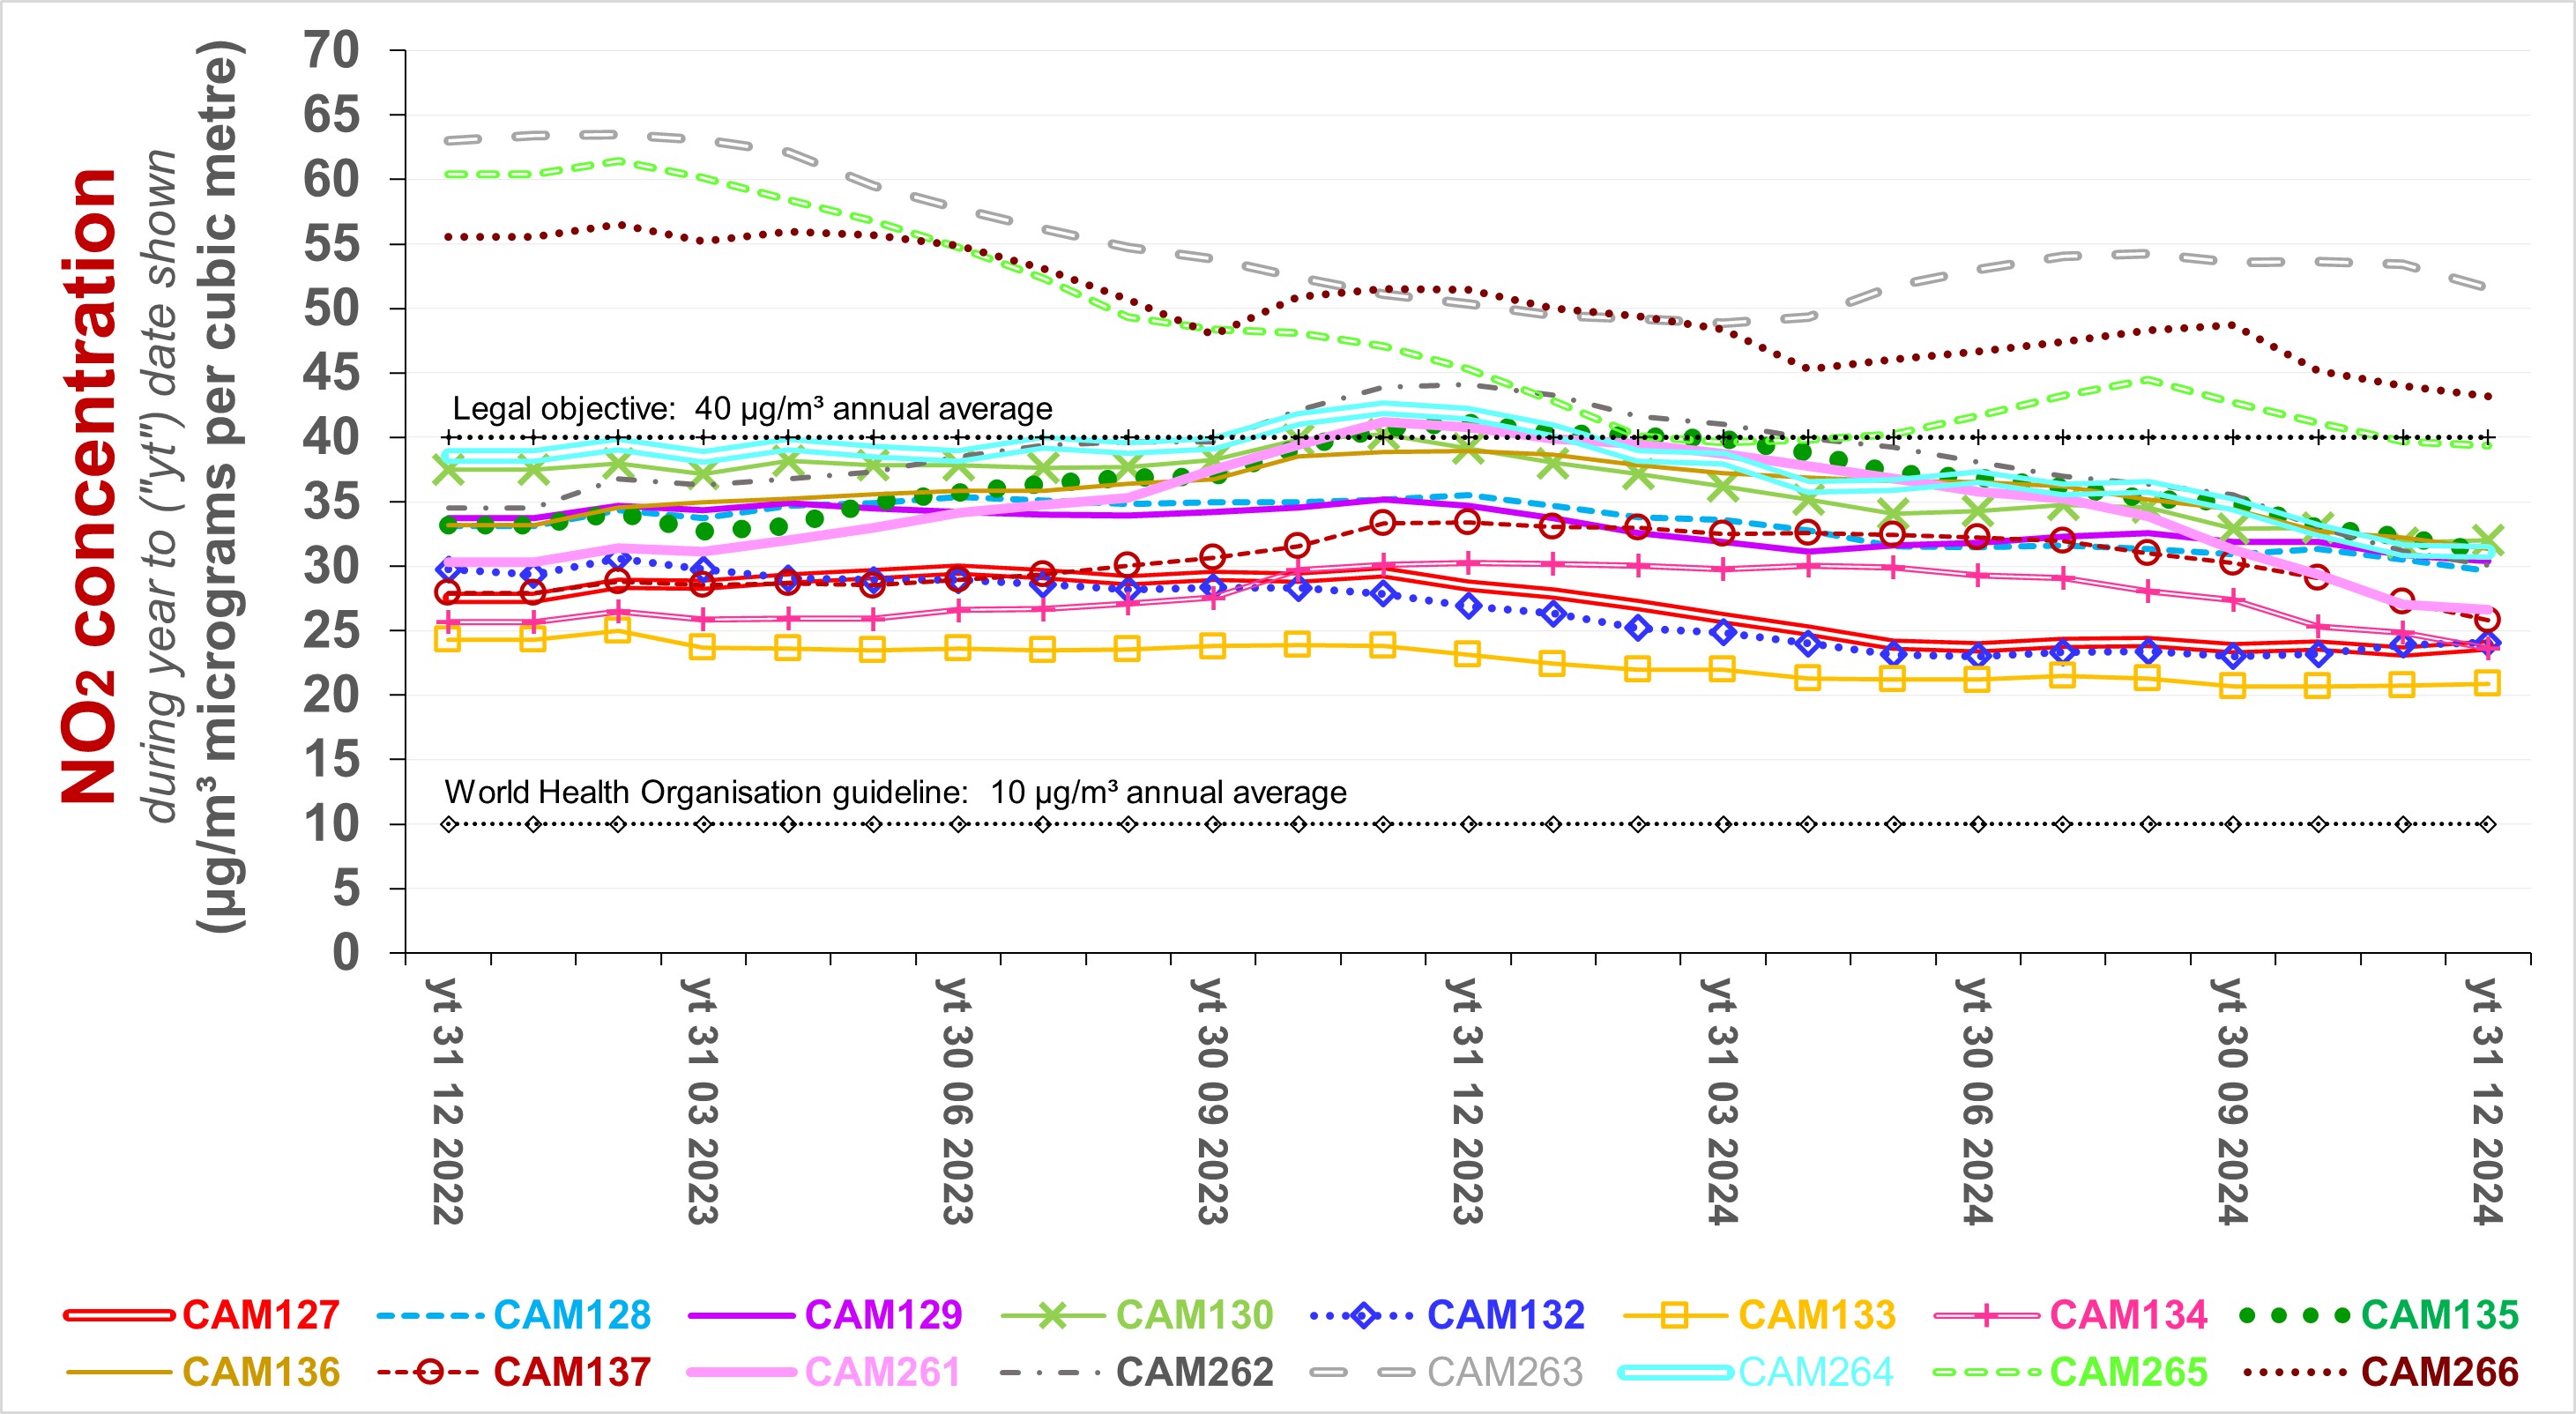
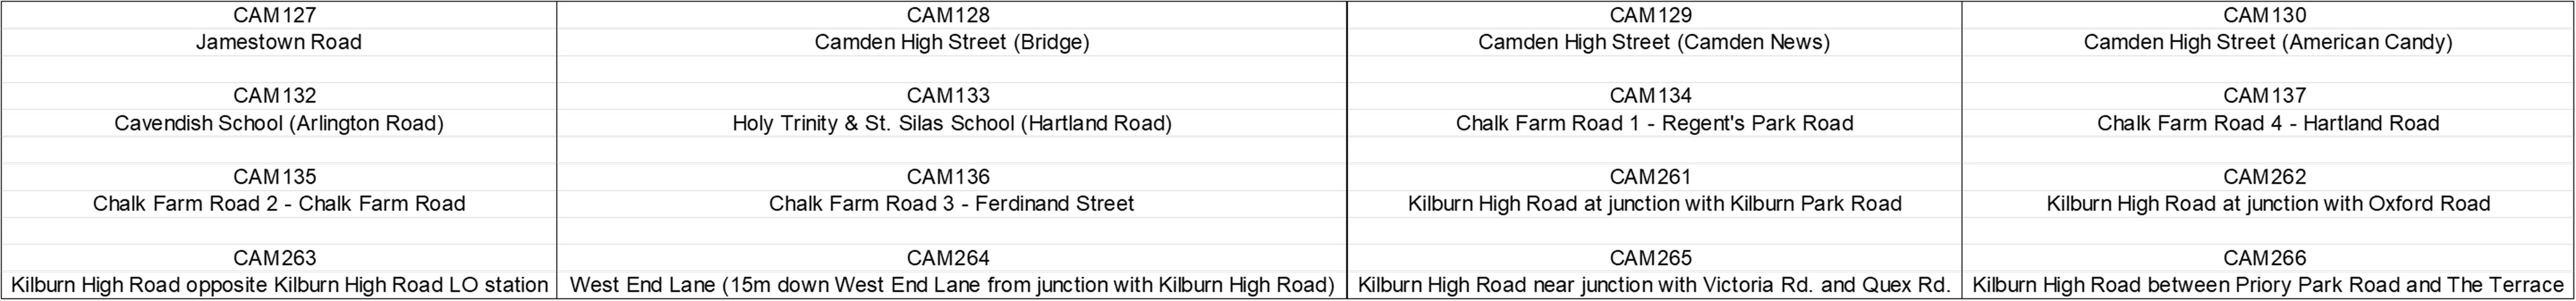
The following three charts illustrate trends in concentrations for successive periods of 12 months at selected locations, as measured (presented without adjustment for bias), based on Annual Status Reports:
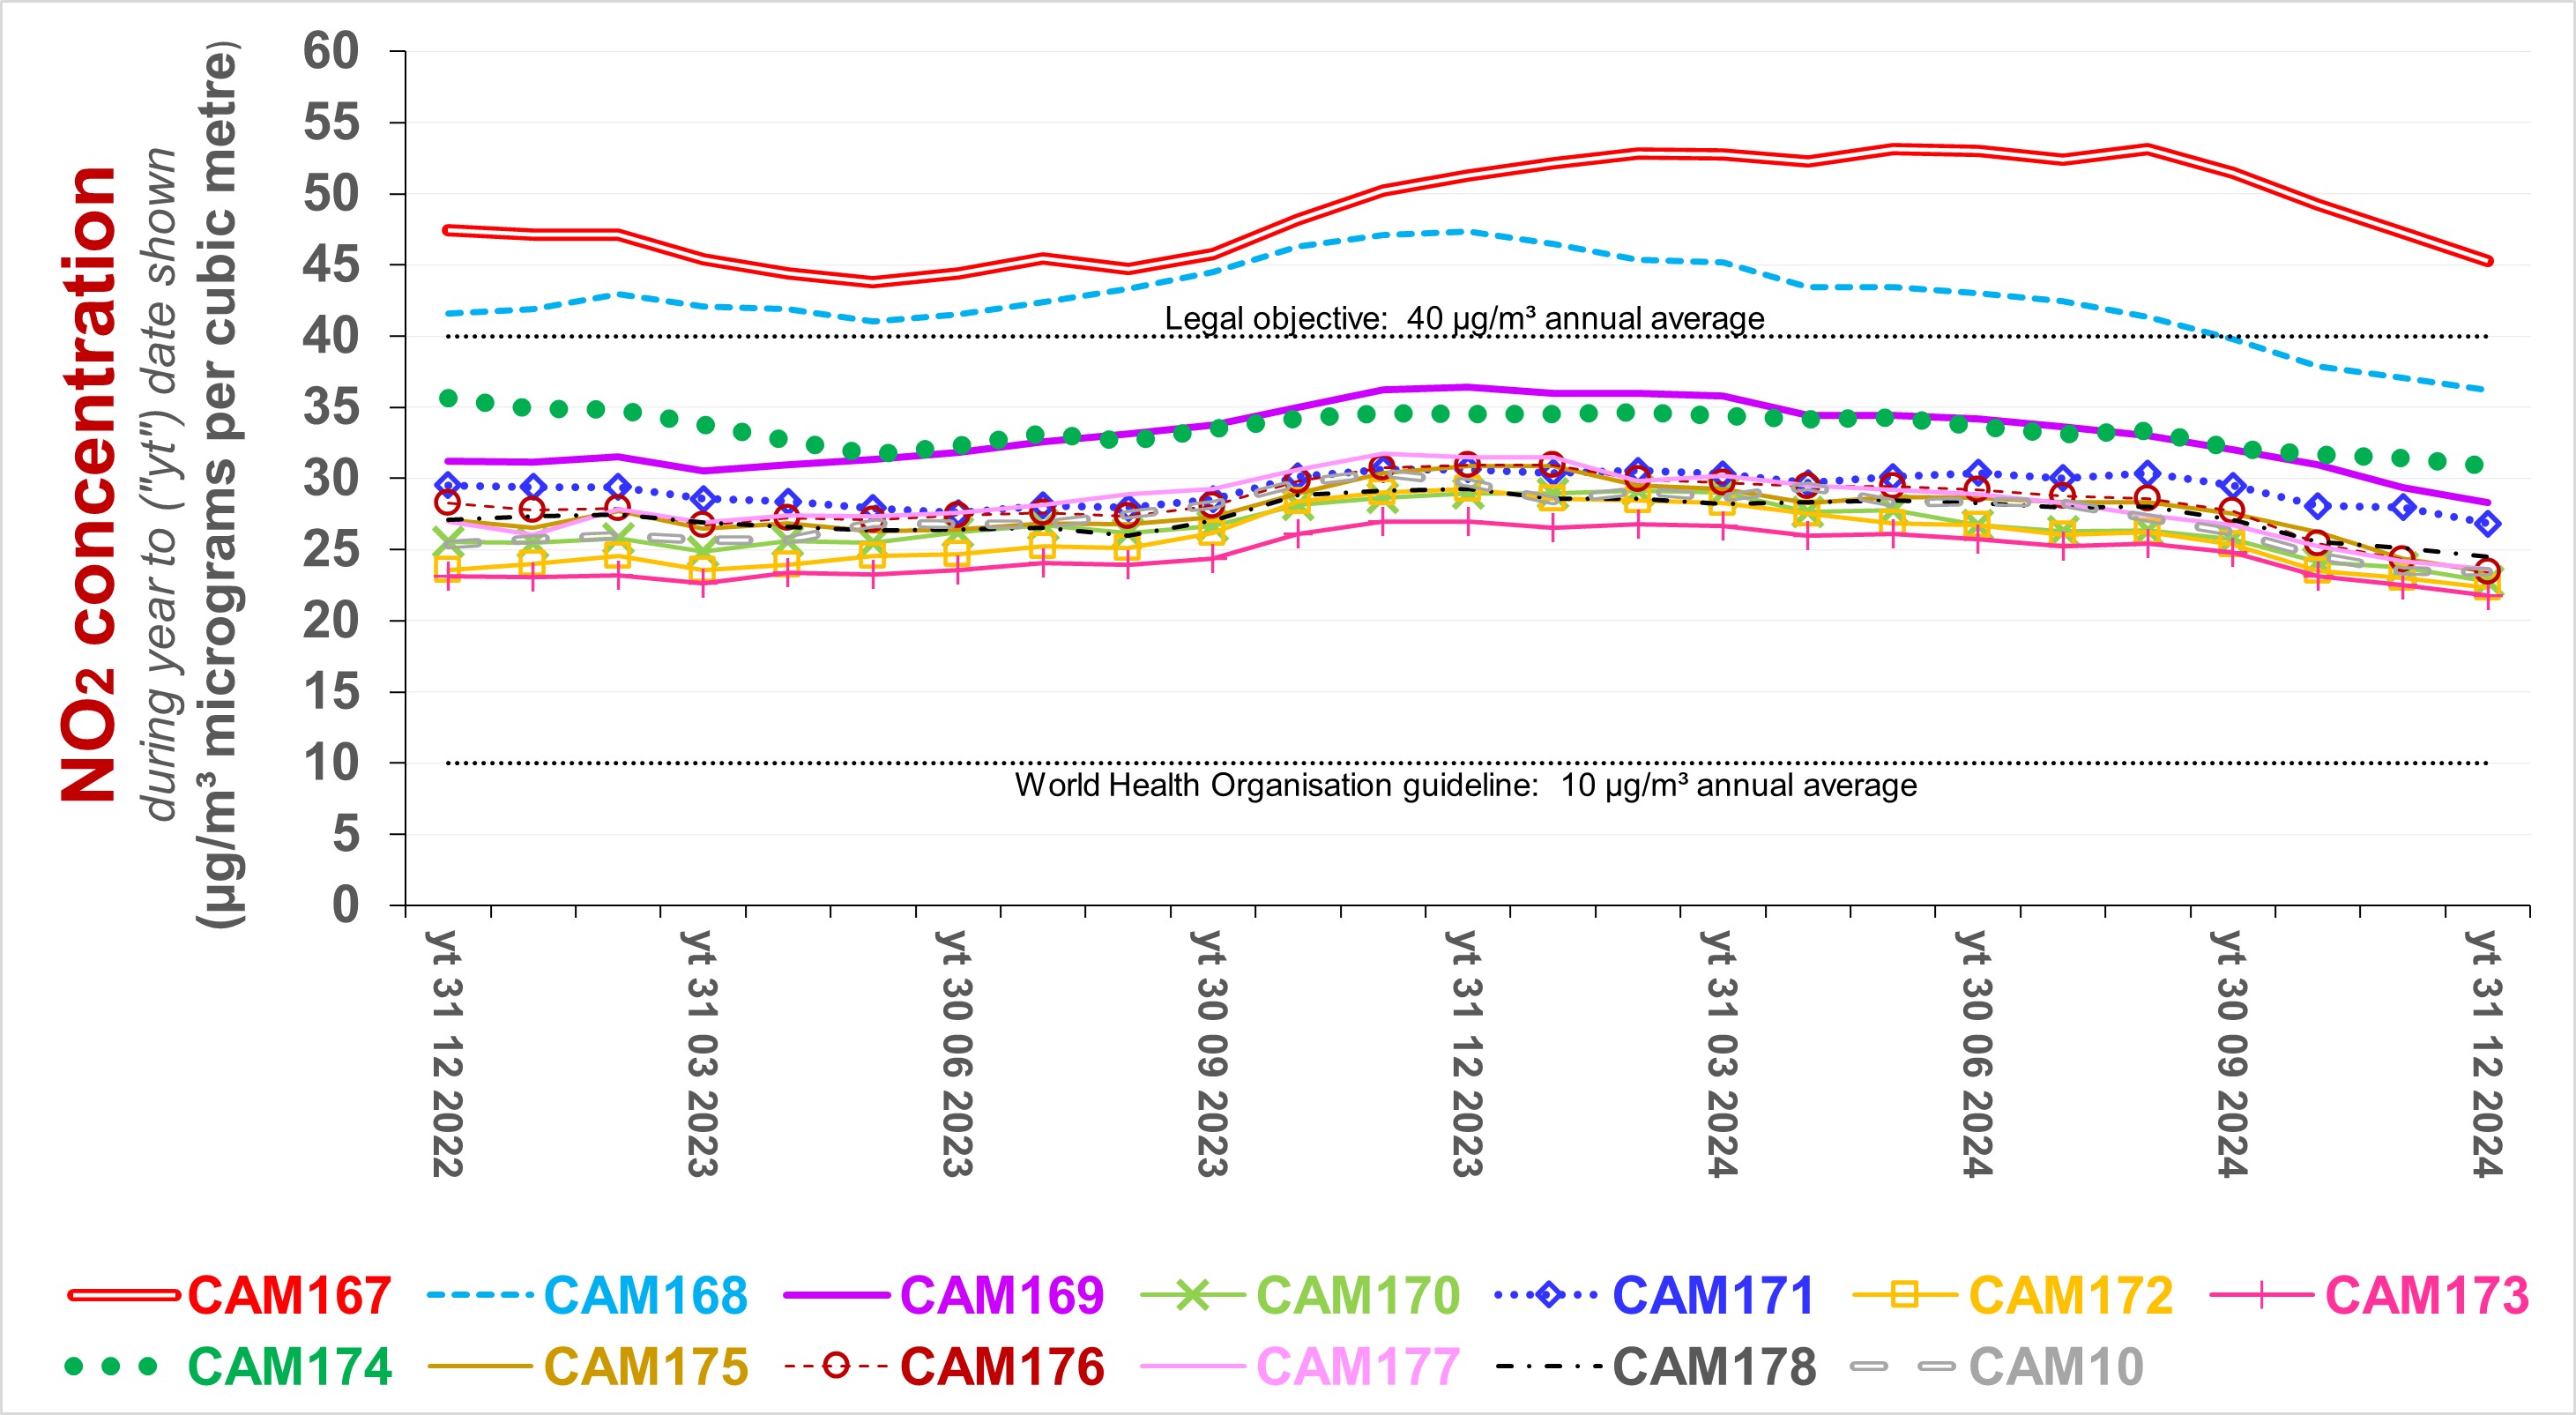
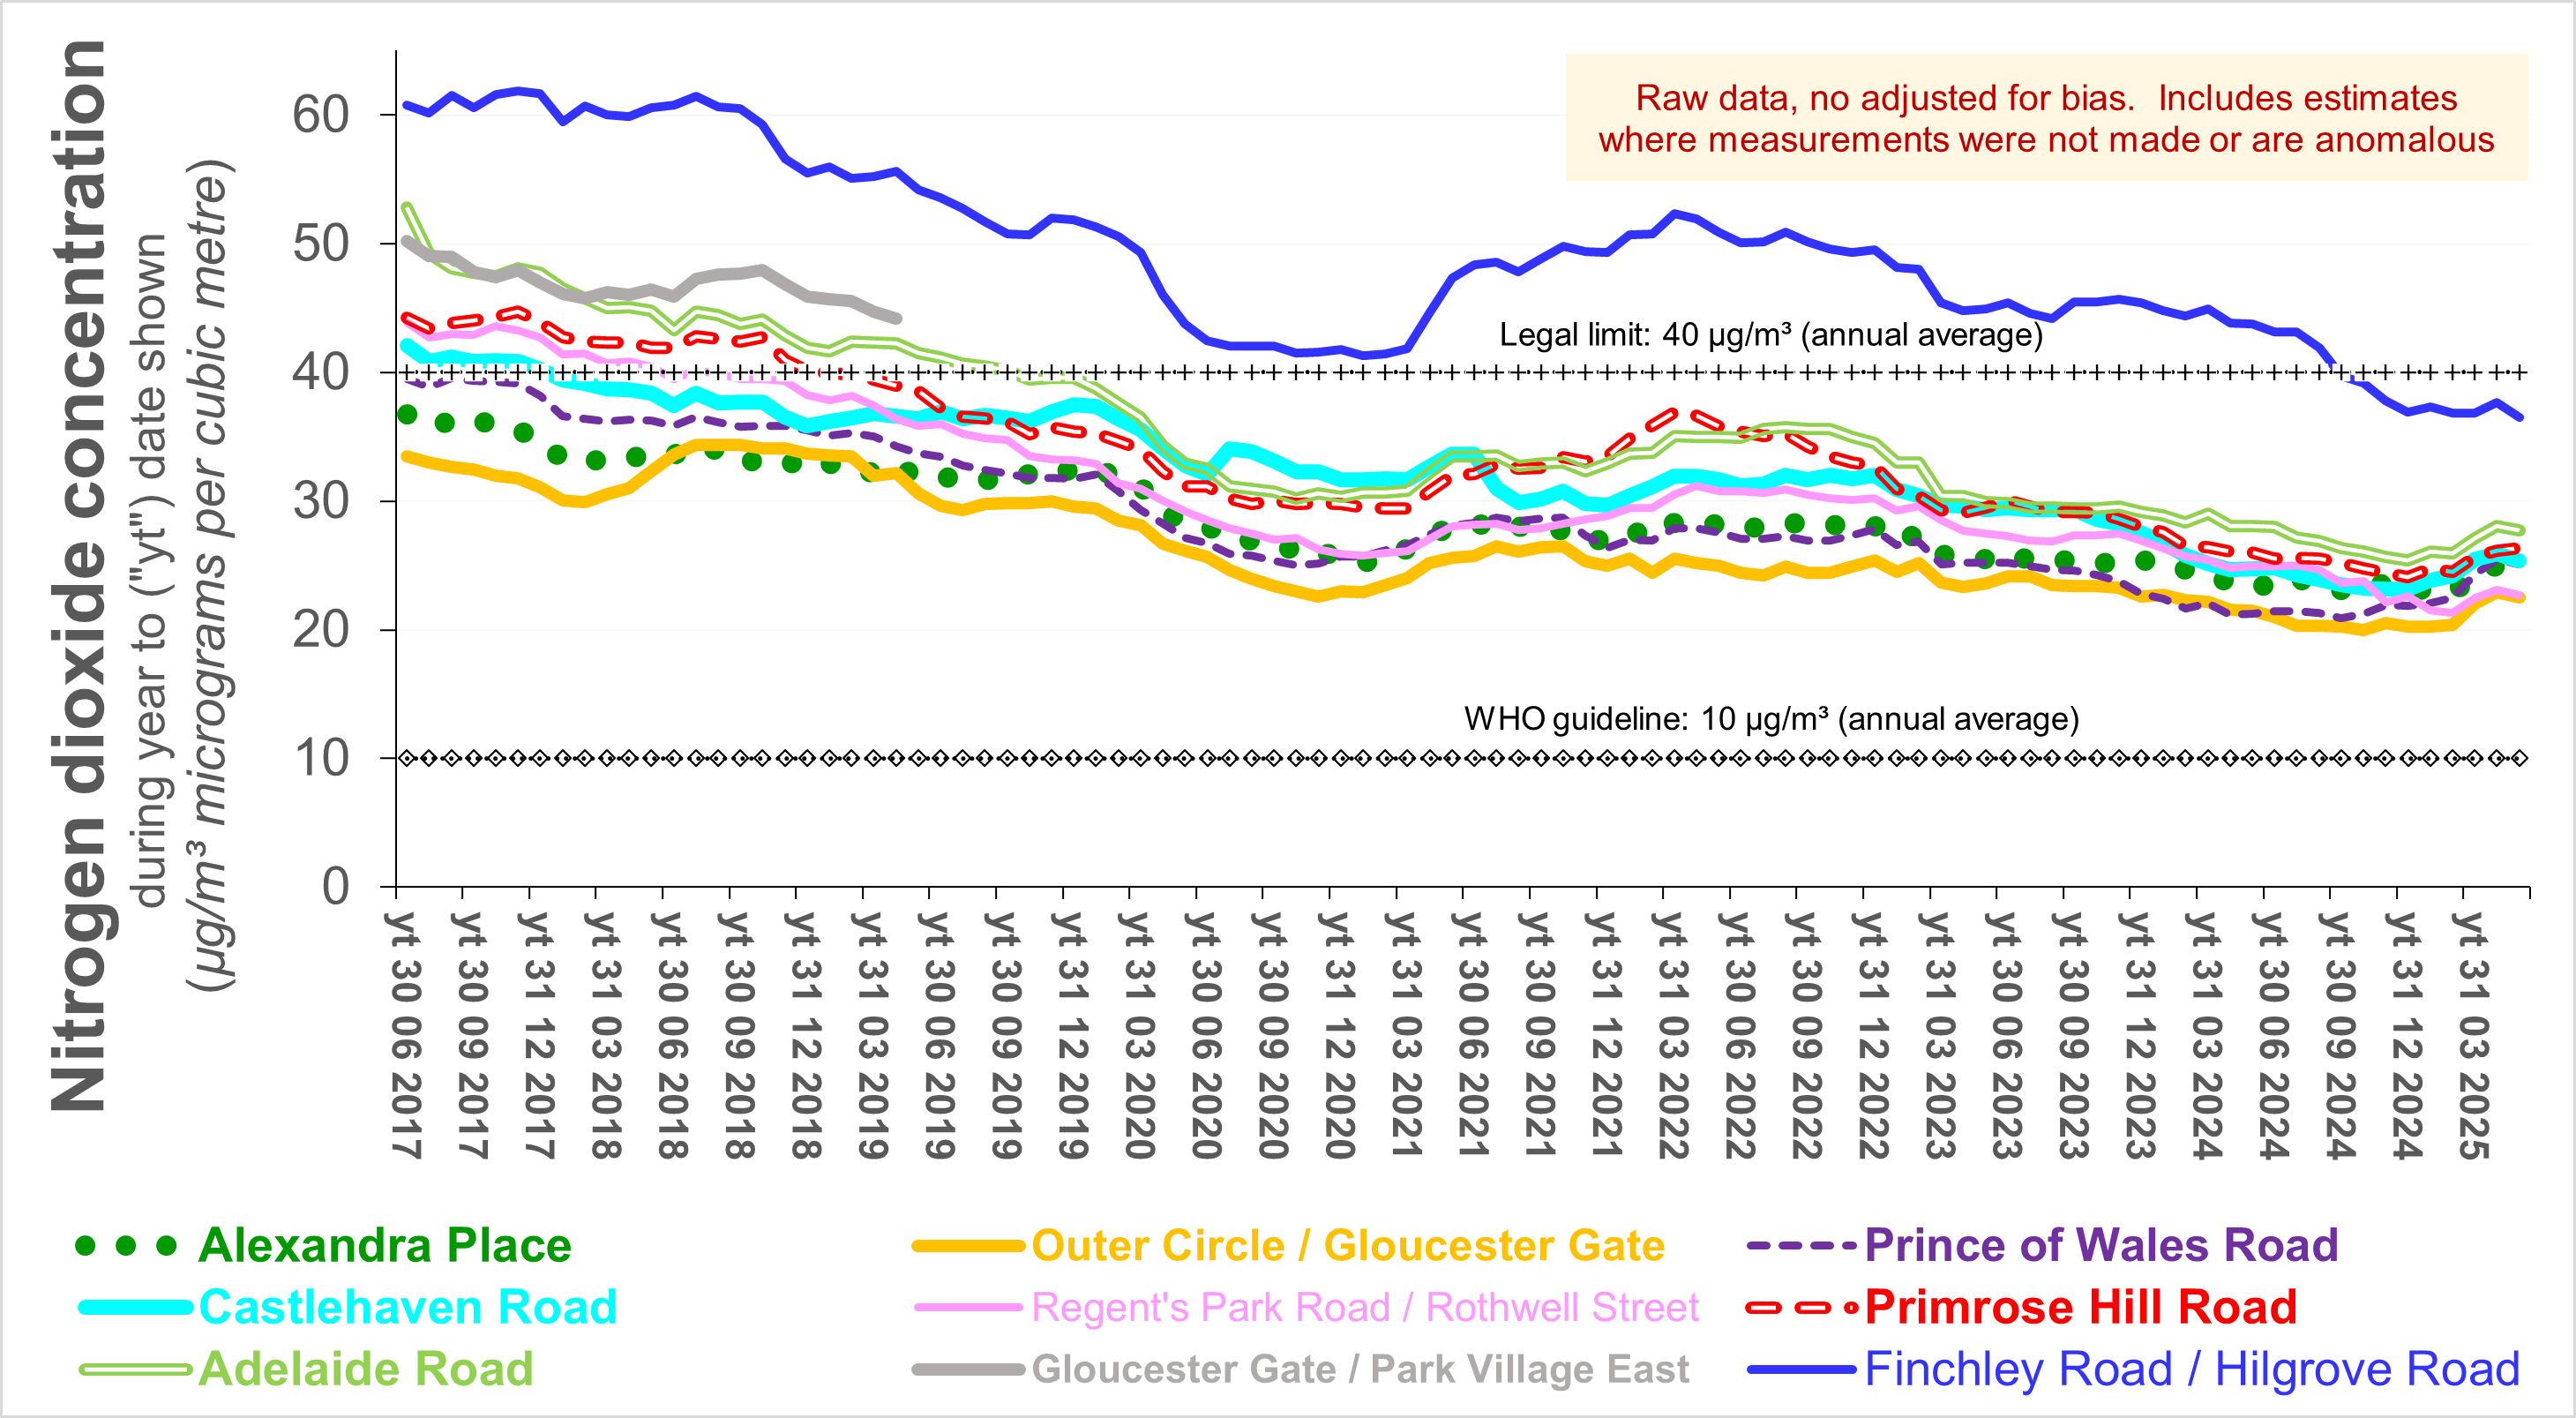
Trends in NO2
concentration measured by
HS2 using diffusion tubes are shown below. Only those in
western Camden are presented here.
|
|
For further information, please contact: info@airqualitymatters.uk |
| Back |