|
AIR QUALITY MATTERS |
|
Borough of Enfield |
|
|
|
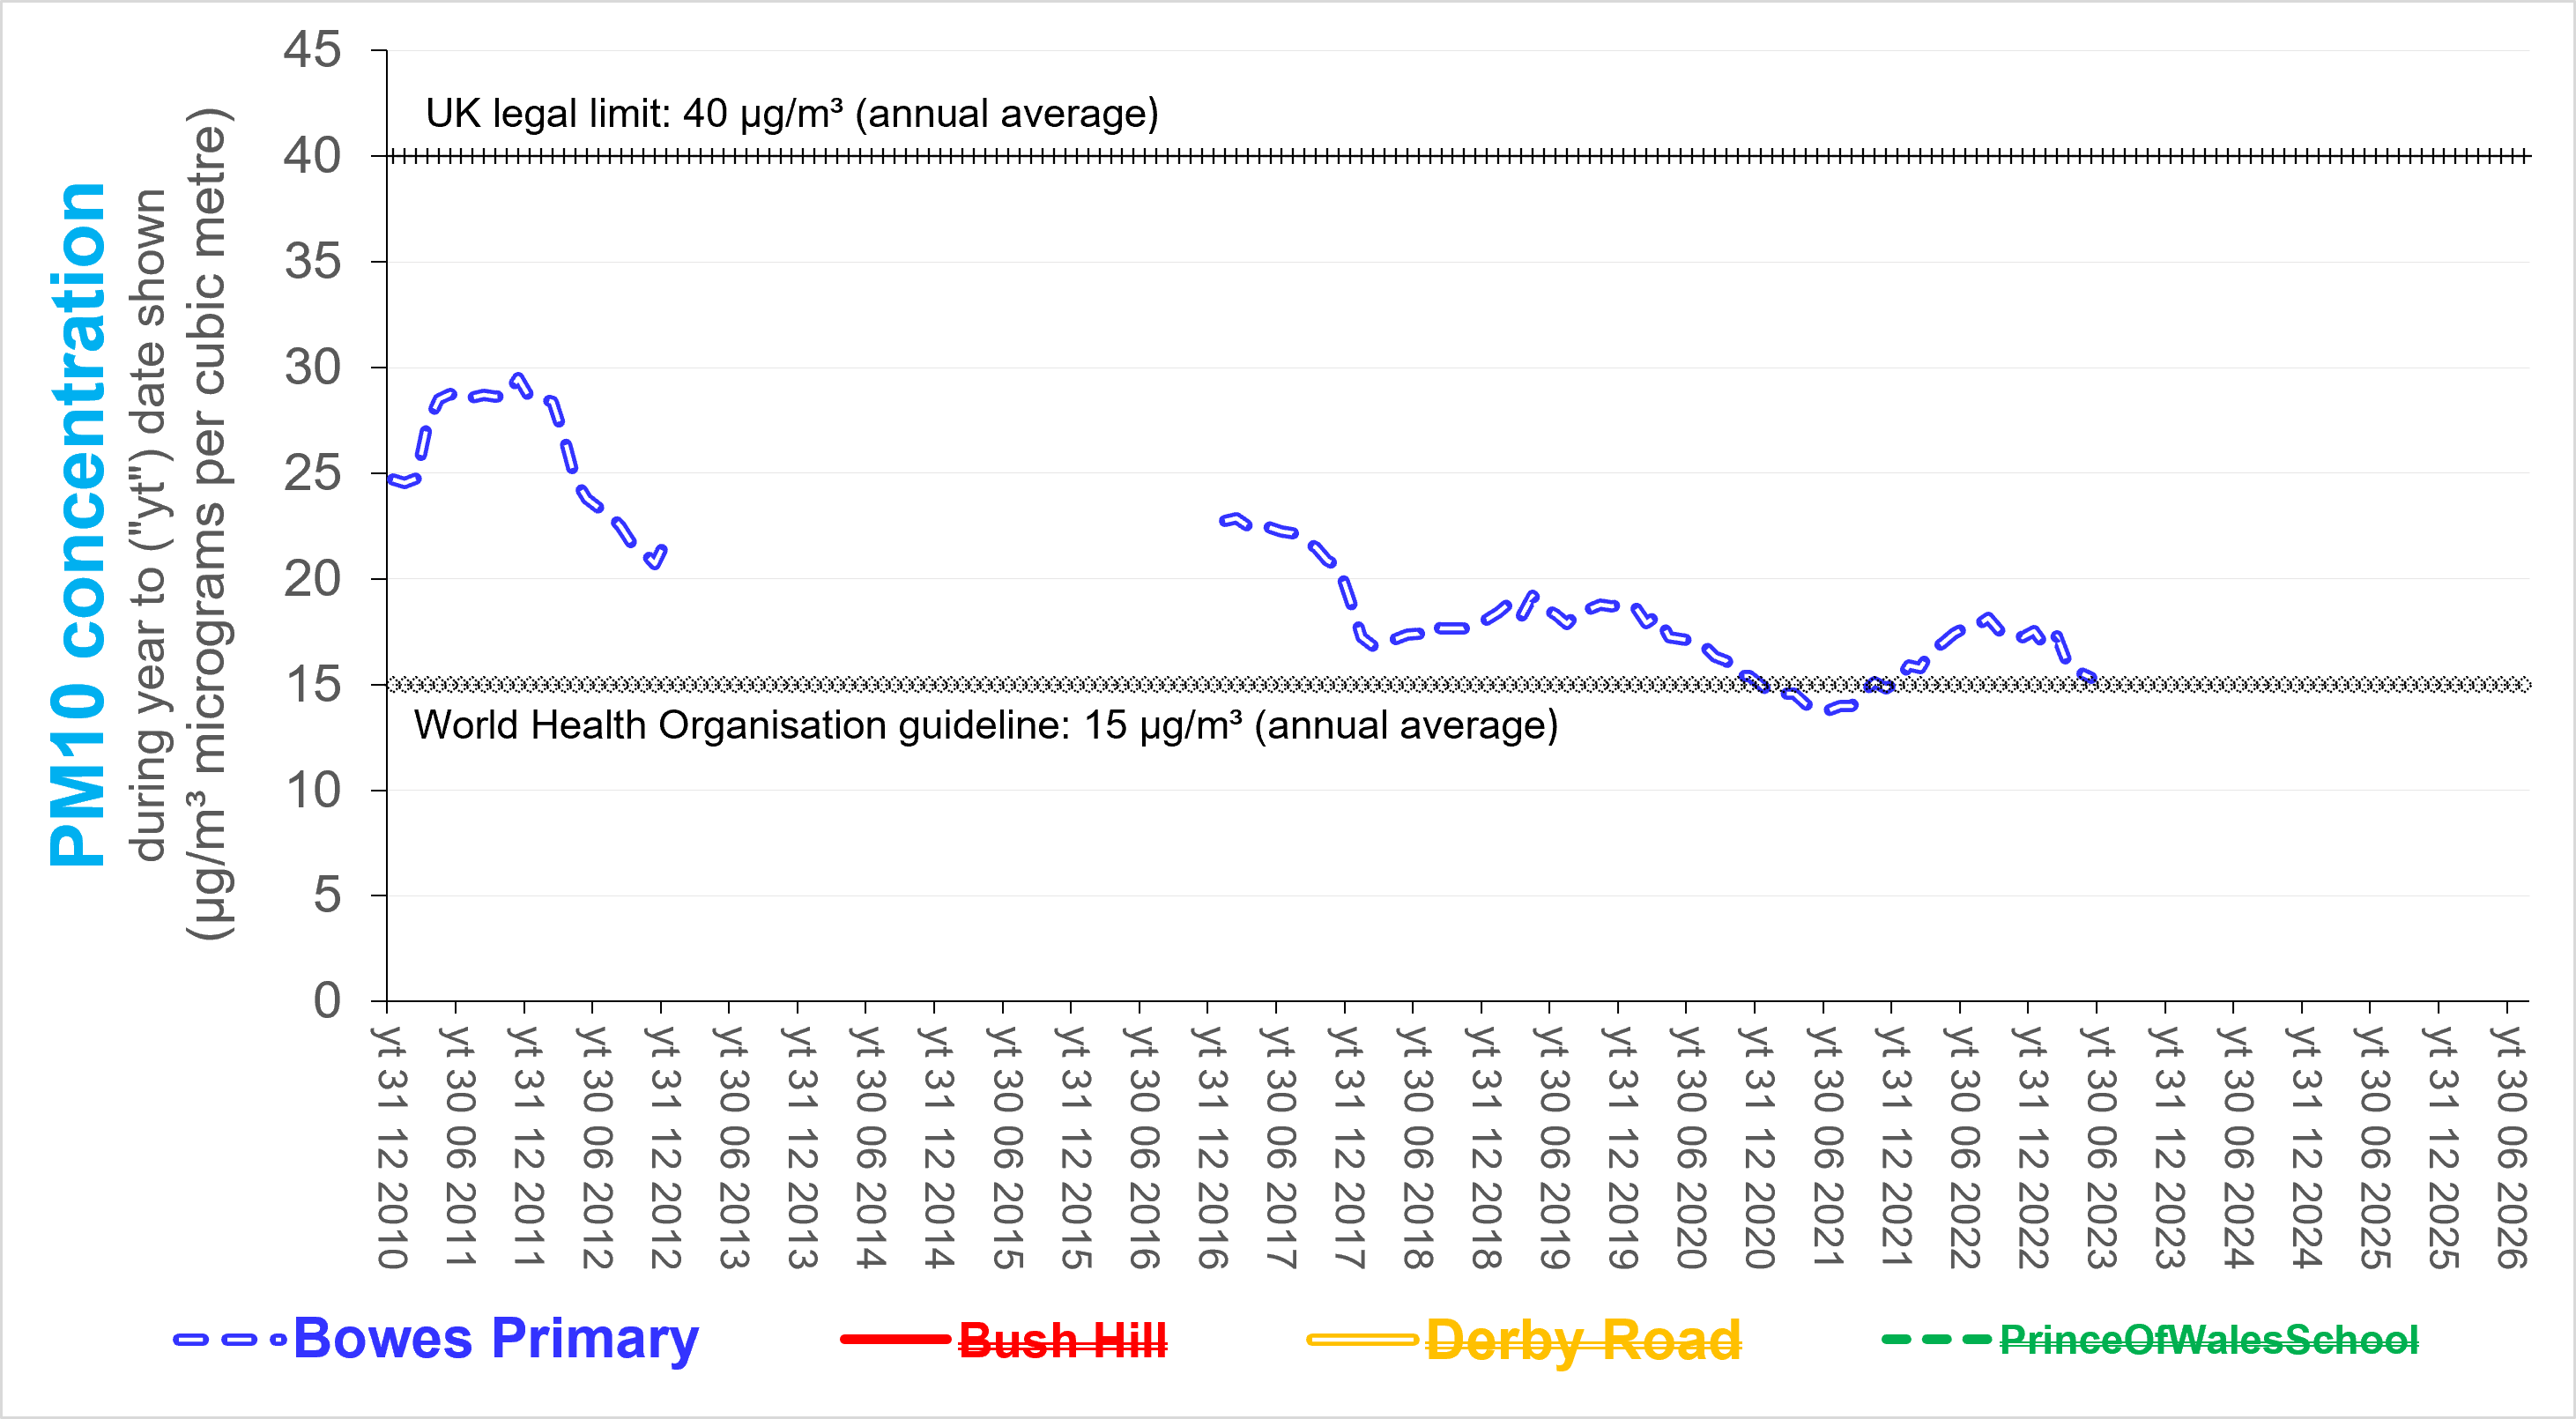
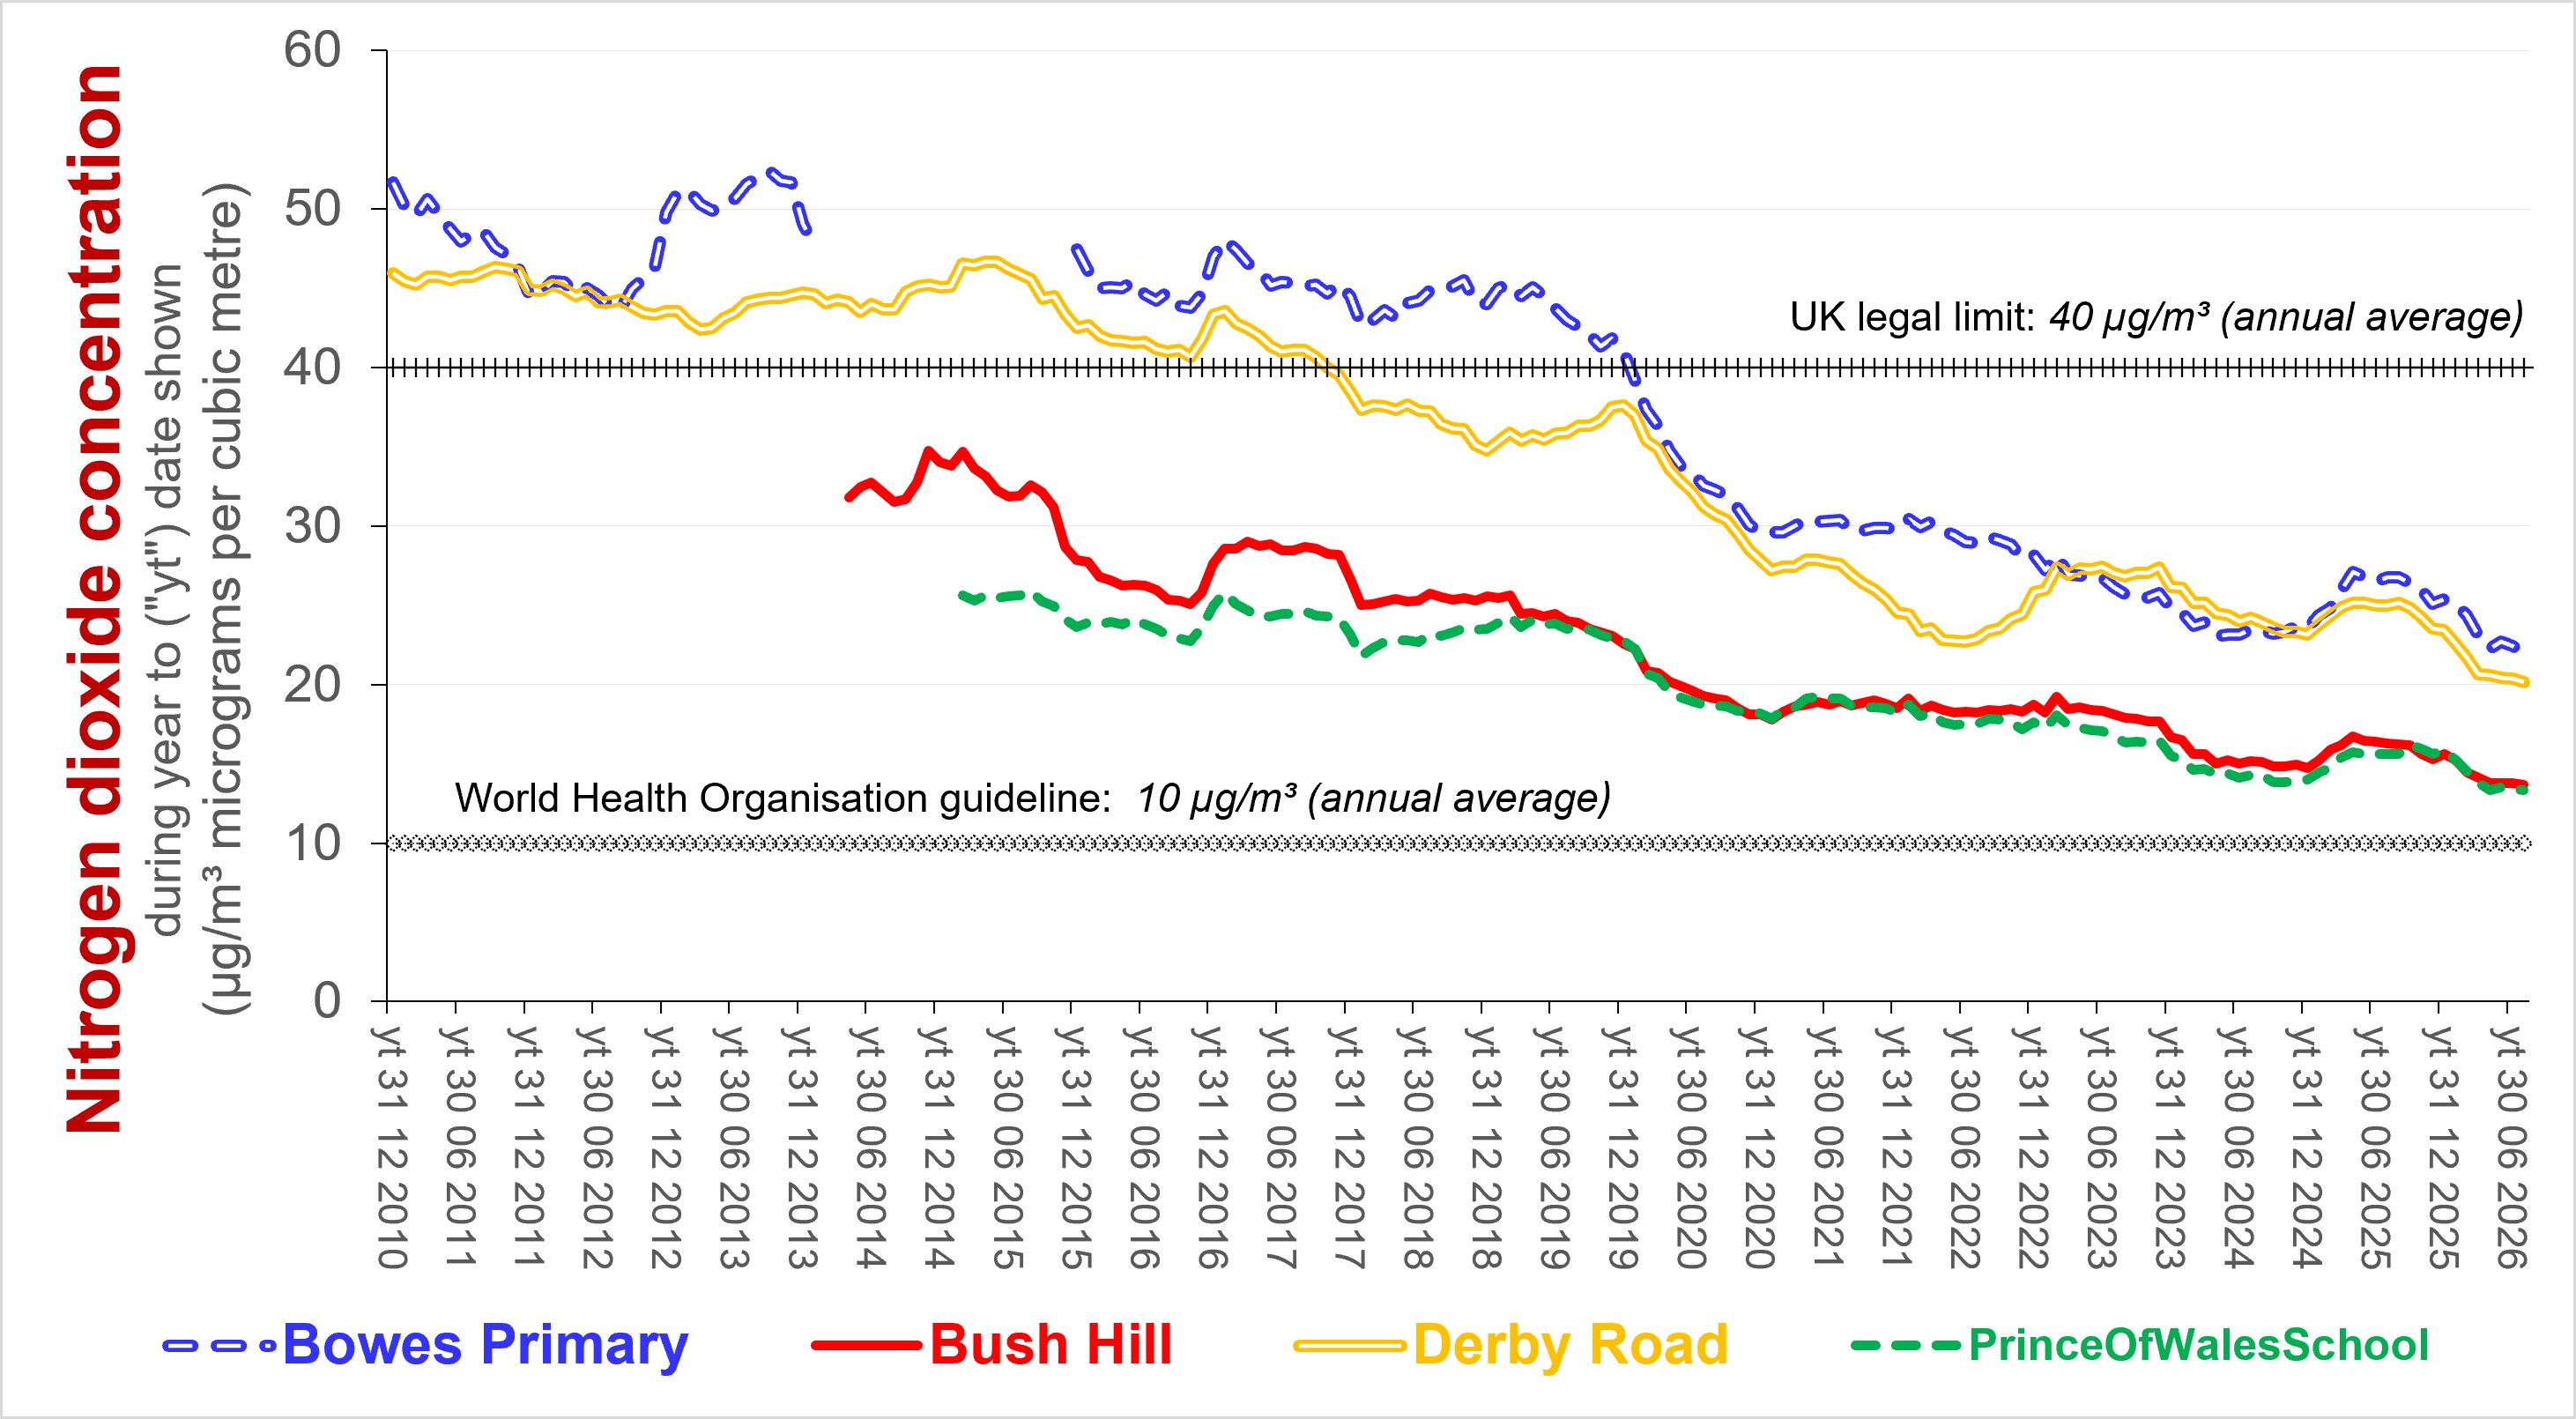
London boroughs monitor one or more or the following four pollutants - the gases nitrogen dioxide ("NO2") and ozone ("O3") and particulate matter of sizes up to 10 microns ("PM10") and up to 2.5 microns ("PM2.5"). Of those four pollutants, PM2.5 is of greatest concern (especially to cardiovascular health). NO2 used to have that top spot (for its harm to respiratory health - notably asthma). The following chart shows that, since 2019, concentrations of NO2 have halved at the four sites where Enfield Council has installed reference monitors. Concentrations at the two most polluted sites are half the legal limit but double the World Health Orgnisation guidelines.
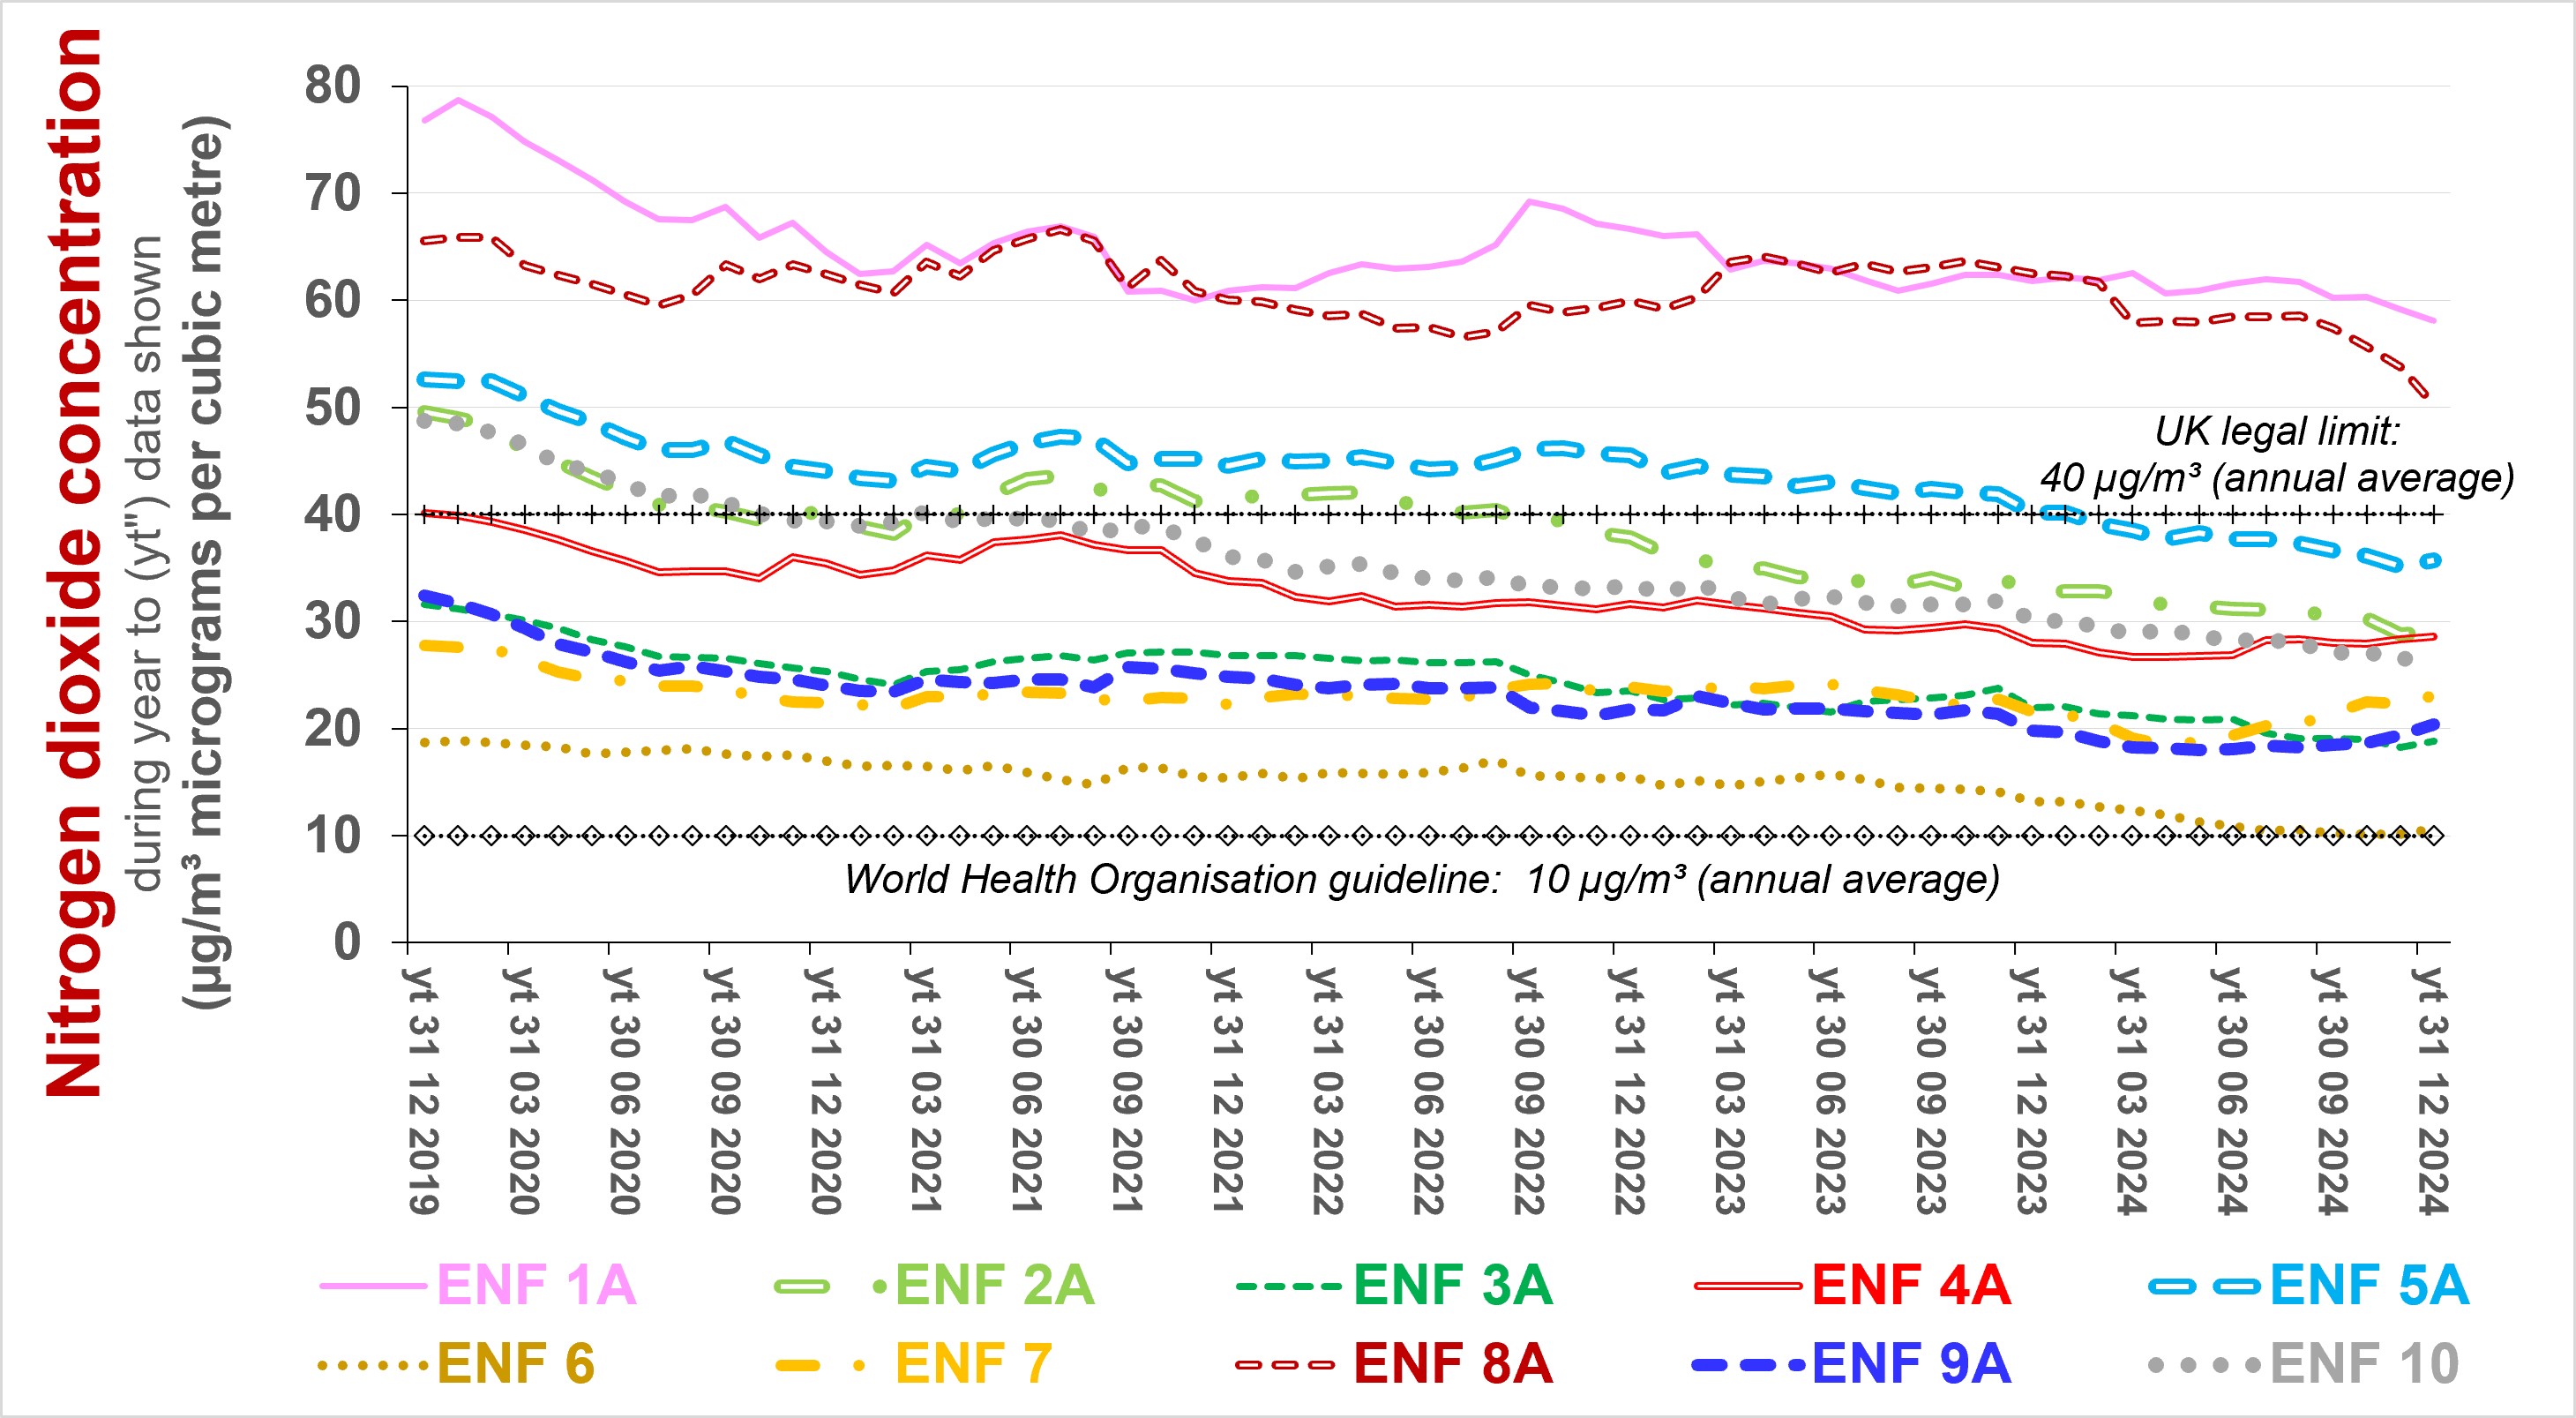
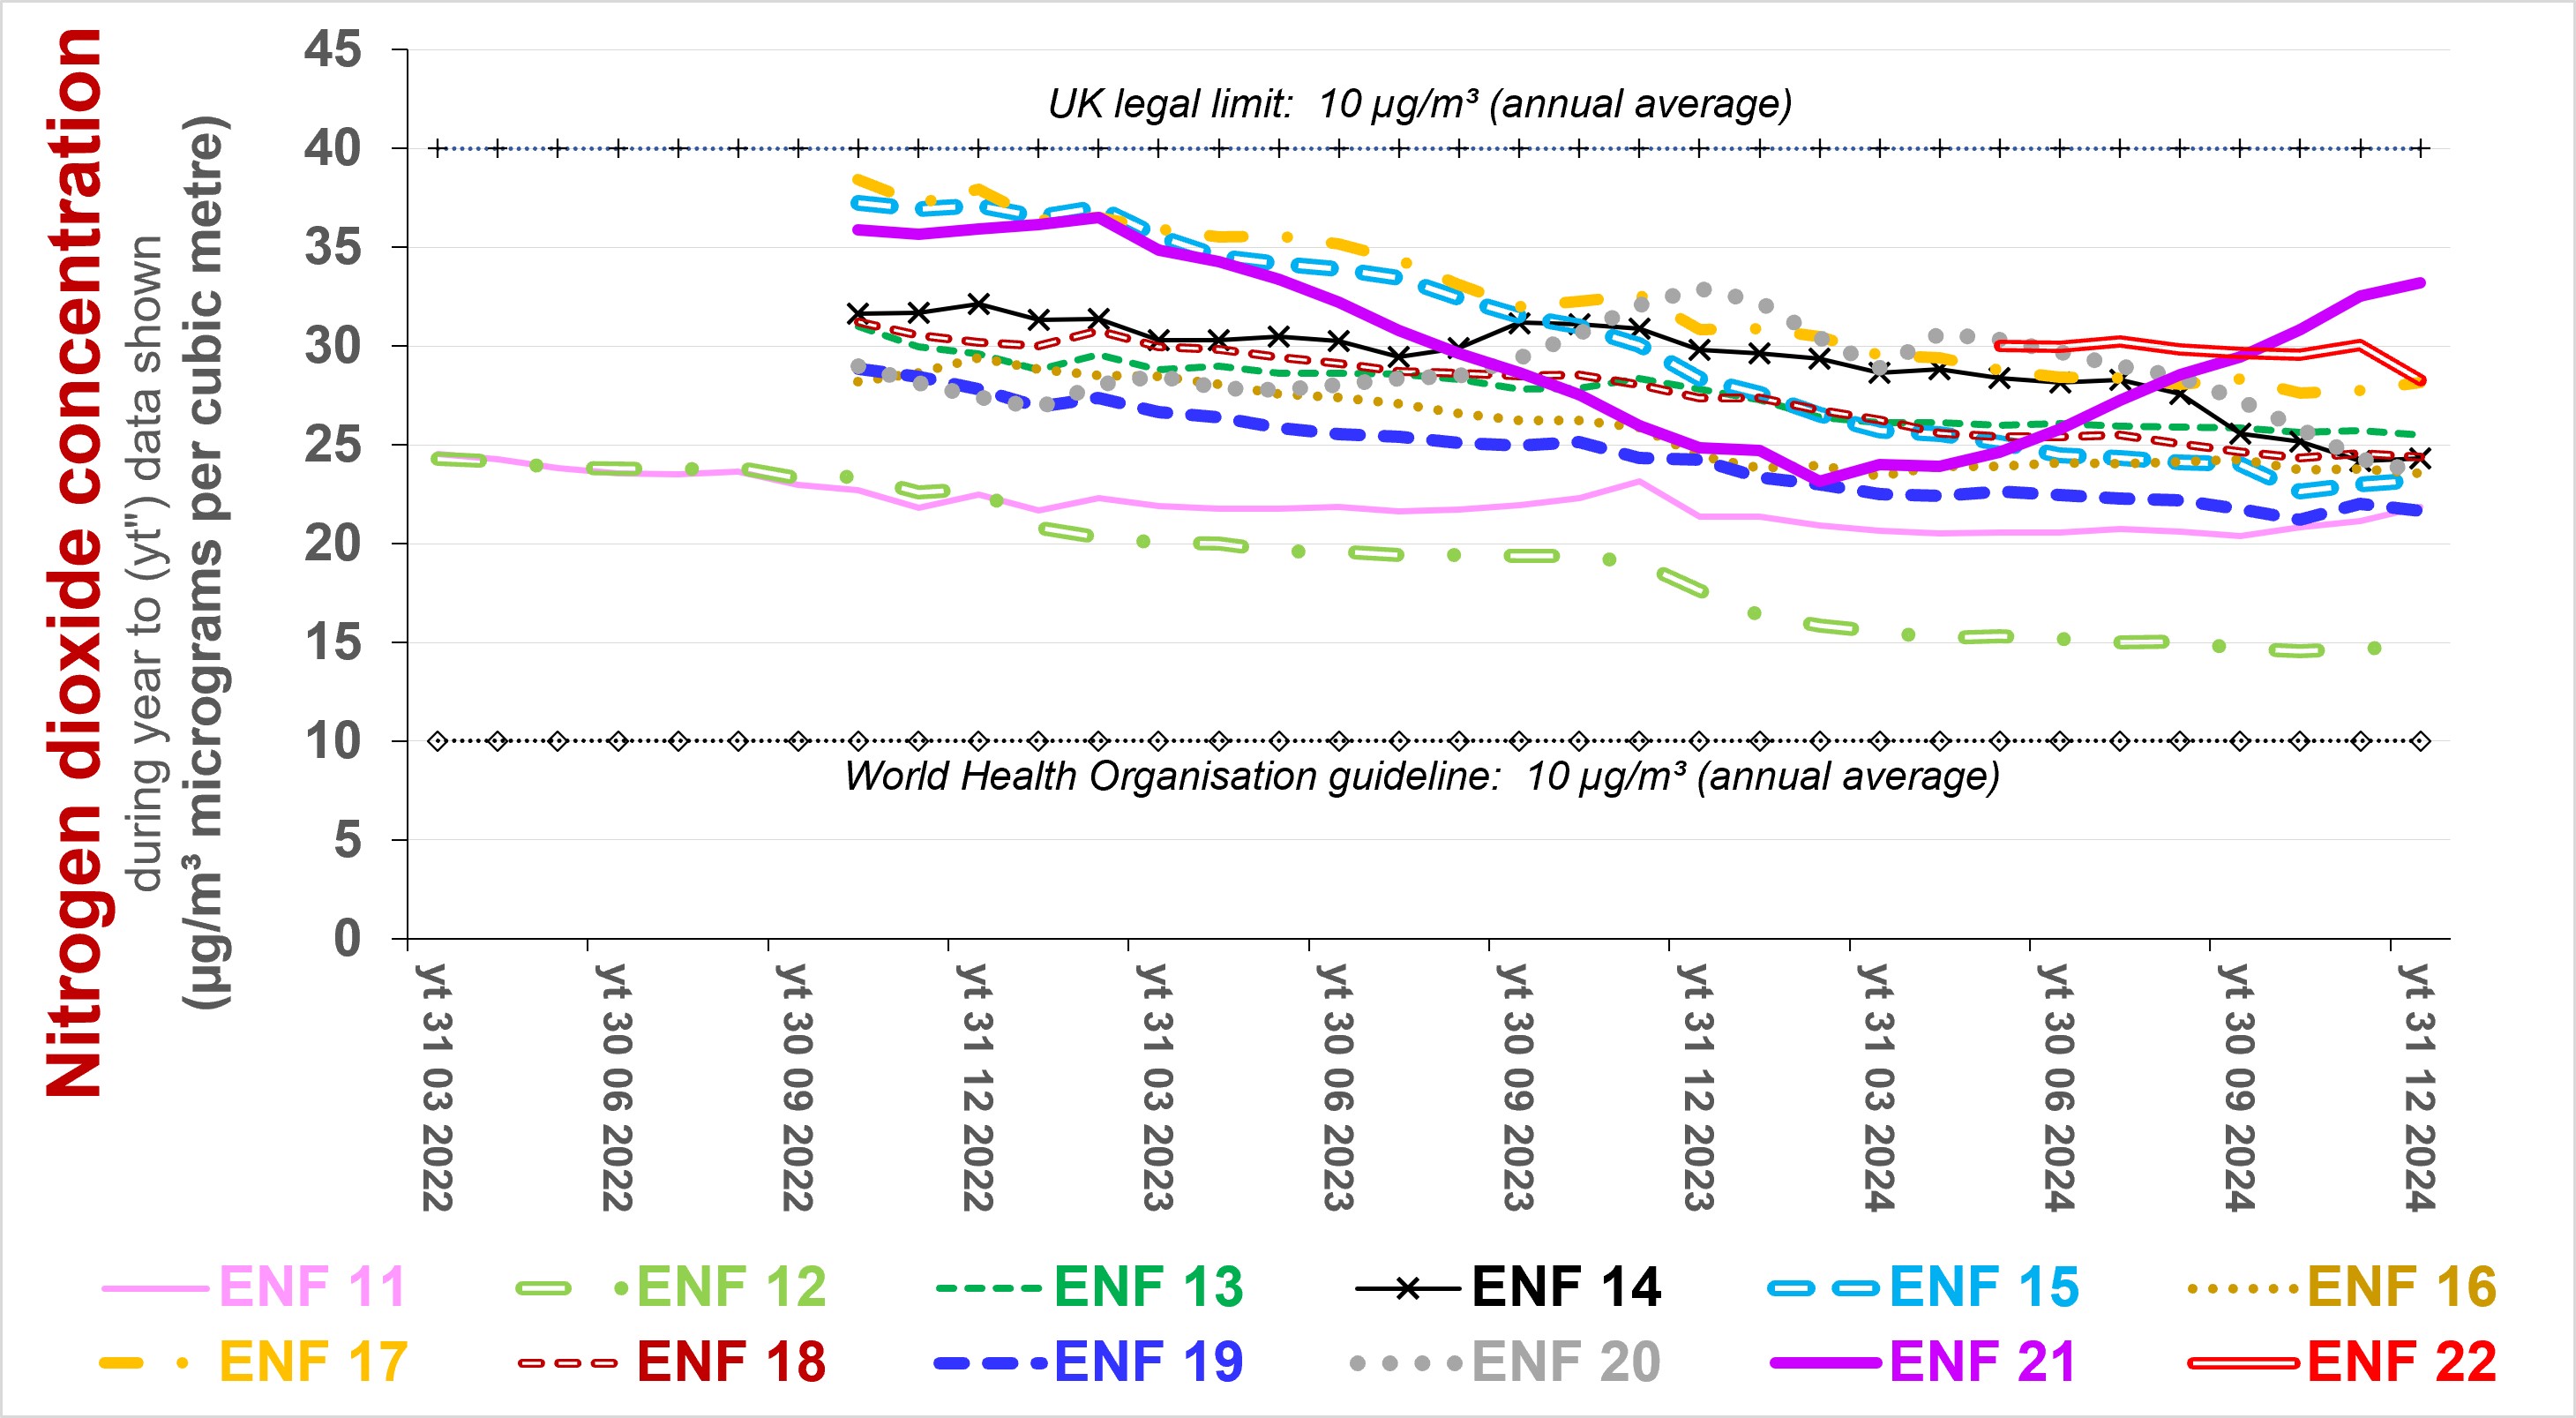
Like other London boroughs, Enfield Council uses diffusion tubes to monitor the monthly average concentration of NO2. The co-ordinates of their locations are provided in the only Air Quality Annual Status Report available from the Council's website, as are maps identifying the sites. The raw measurements the tubes generate are shown on the two following charts. They are based on the GLA's "London Datastore" and should be multiplied by about 0.8 to adjust for the inherent bias of the tubes.
|
|
For further information, please contact: info@airqualitymatters.uk |
| Back |
 .
.