|
AIR QUALITY MATTERS |
|
Borough of Hackney |
|
|
|
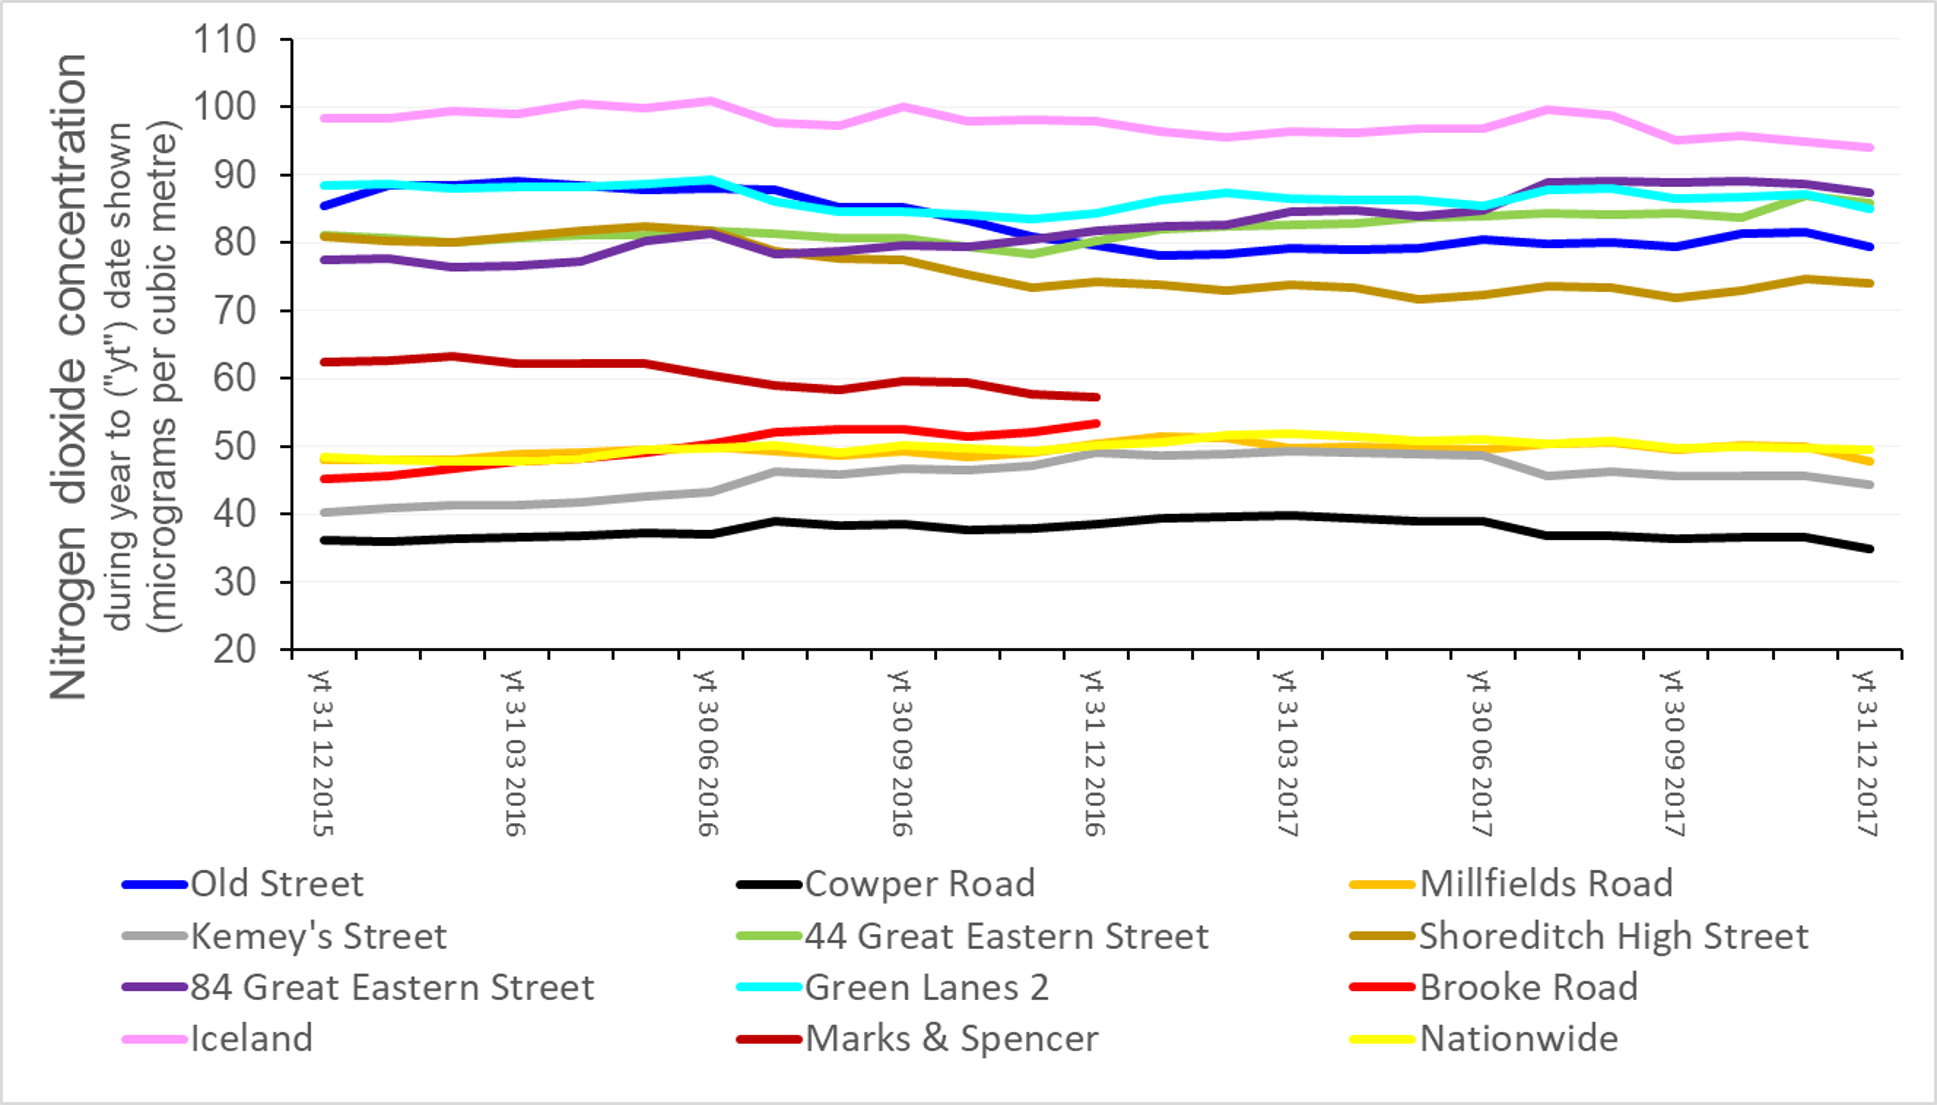
The following chart shows how the annual average concentration of NO2 changed between 2015 and 2017 at a selection of sites in the Borough of Hackney. Click on the chart in order to view charts of several other sites.
The data above indicate that NO2
concentrations exceed the legal limit at all the sites
shown, and are not decreasing.
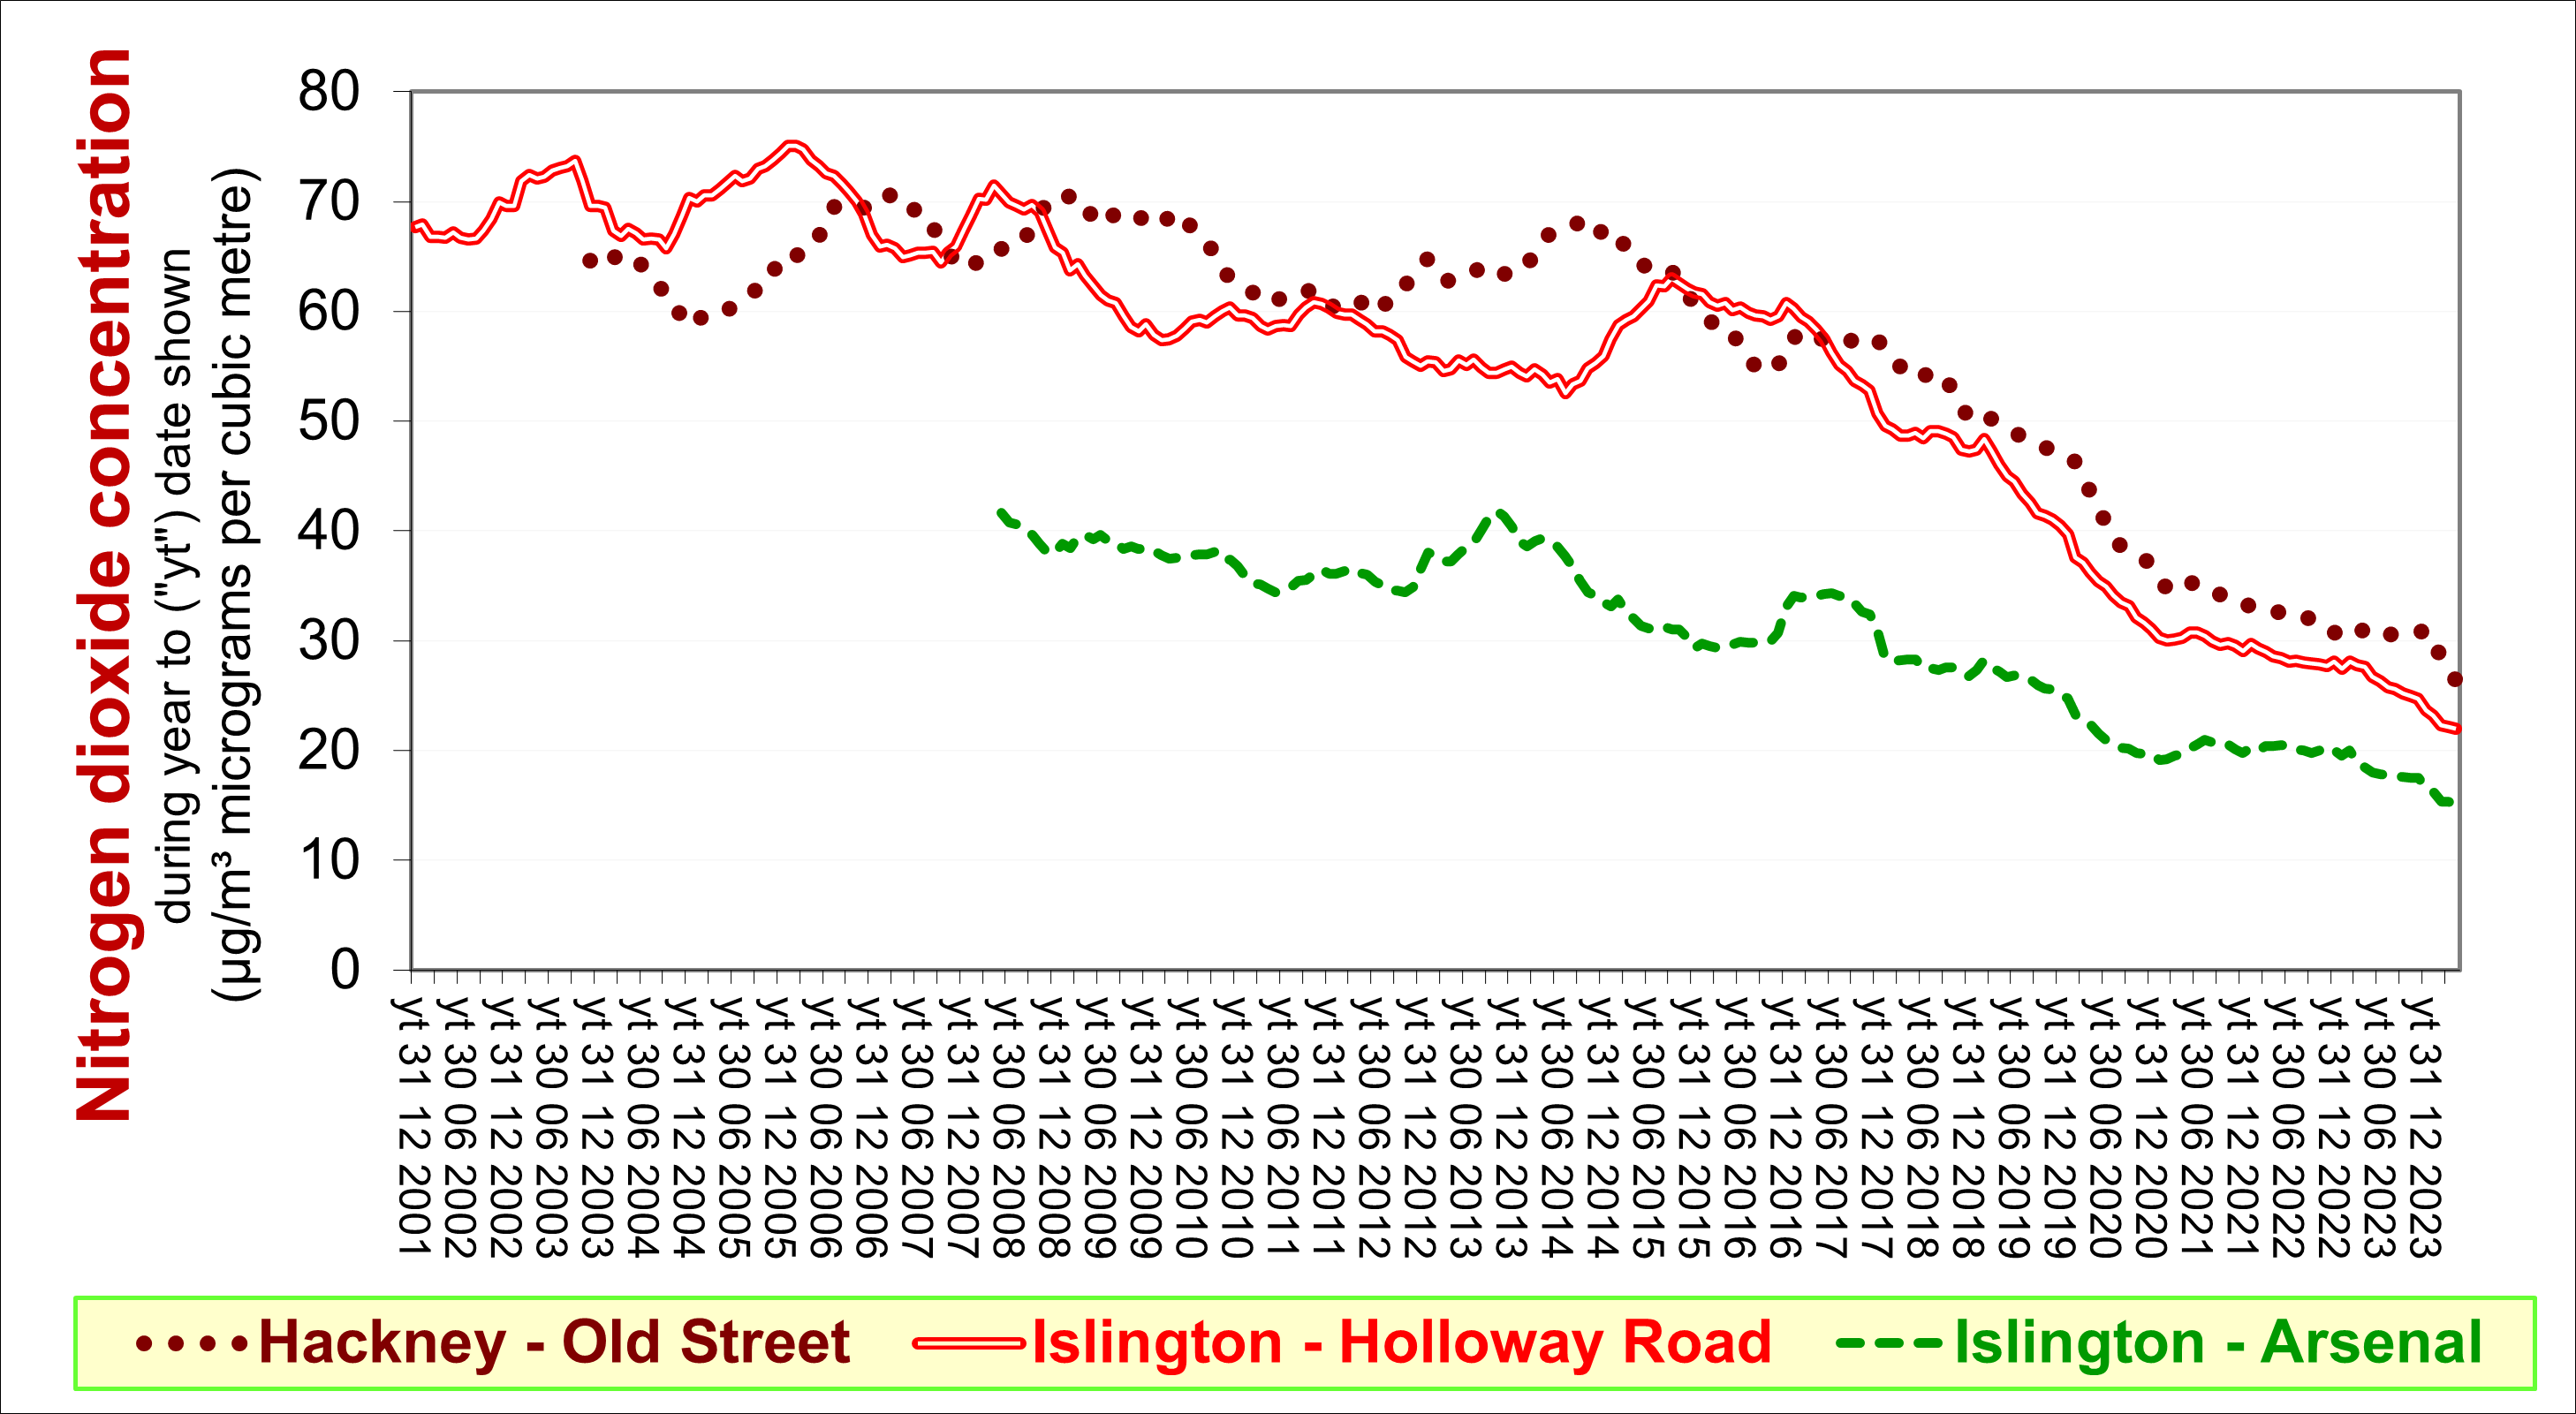
In contrast, data continuously measured in Old Street (shown on
the following chart) suggest that air quality there is clearly
improving:
Source of data: London Air (prior to 2021) and Air Quality England (from 2021)
|
|
For further information, please contact: info@airqualitymatters.uk |
| Back |