|
AIR QUALITY MATTERS |
|||||
|
St Albans and District |
|||||
|
|
|||||
|
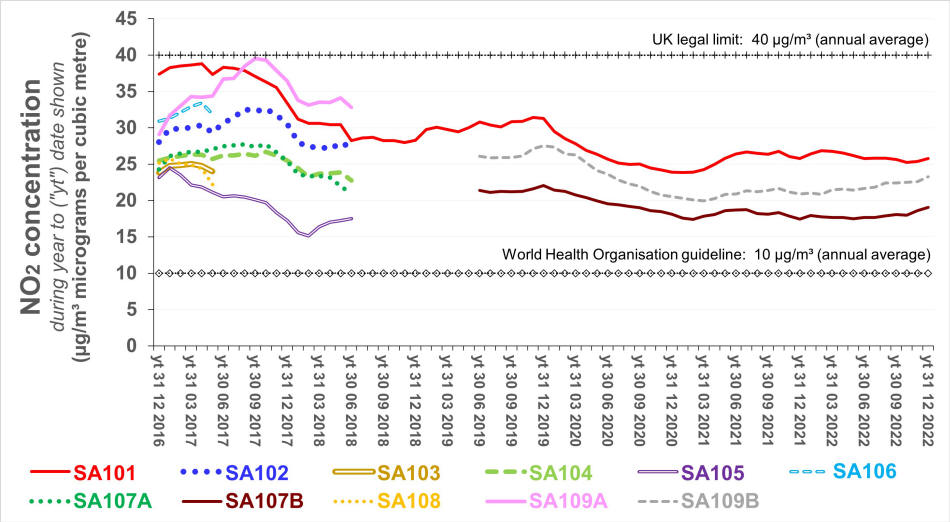
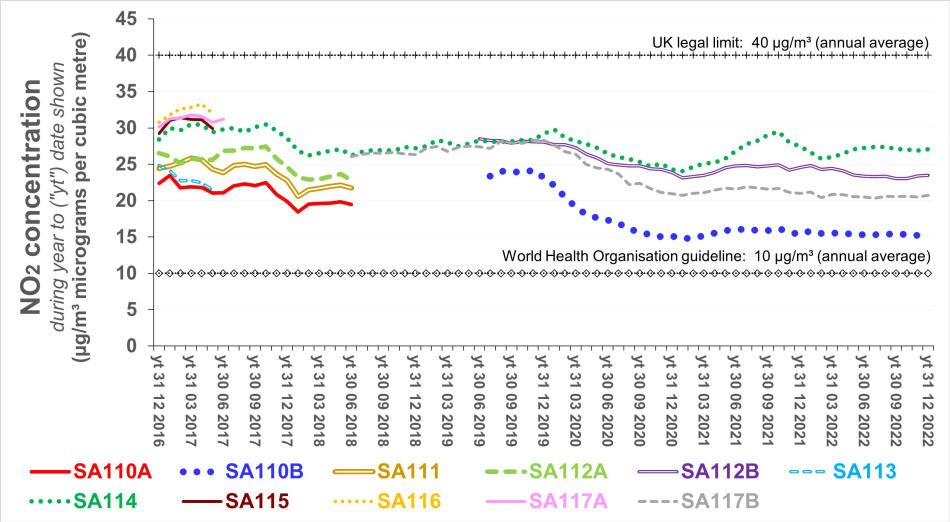
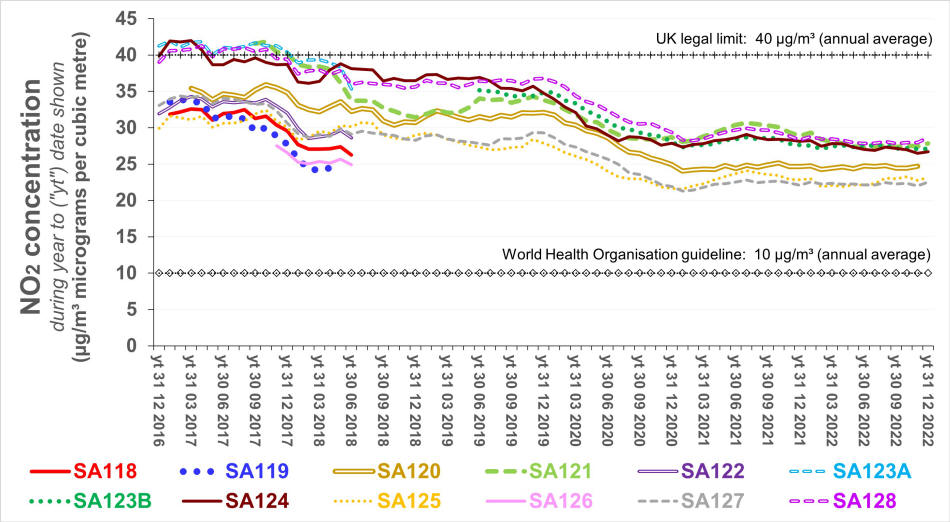
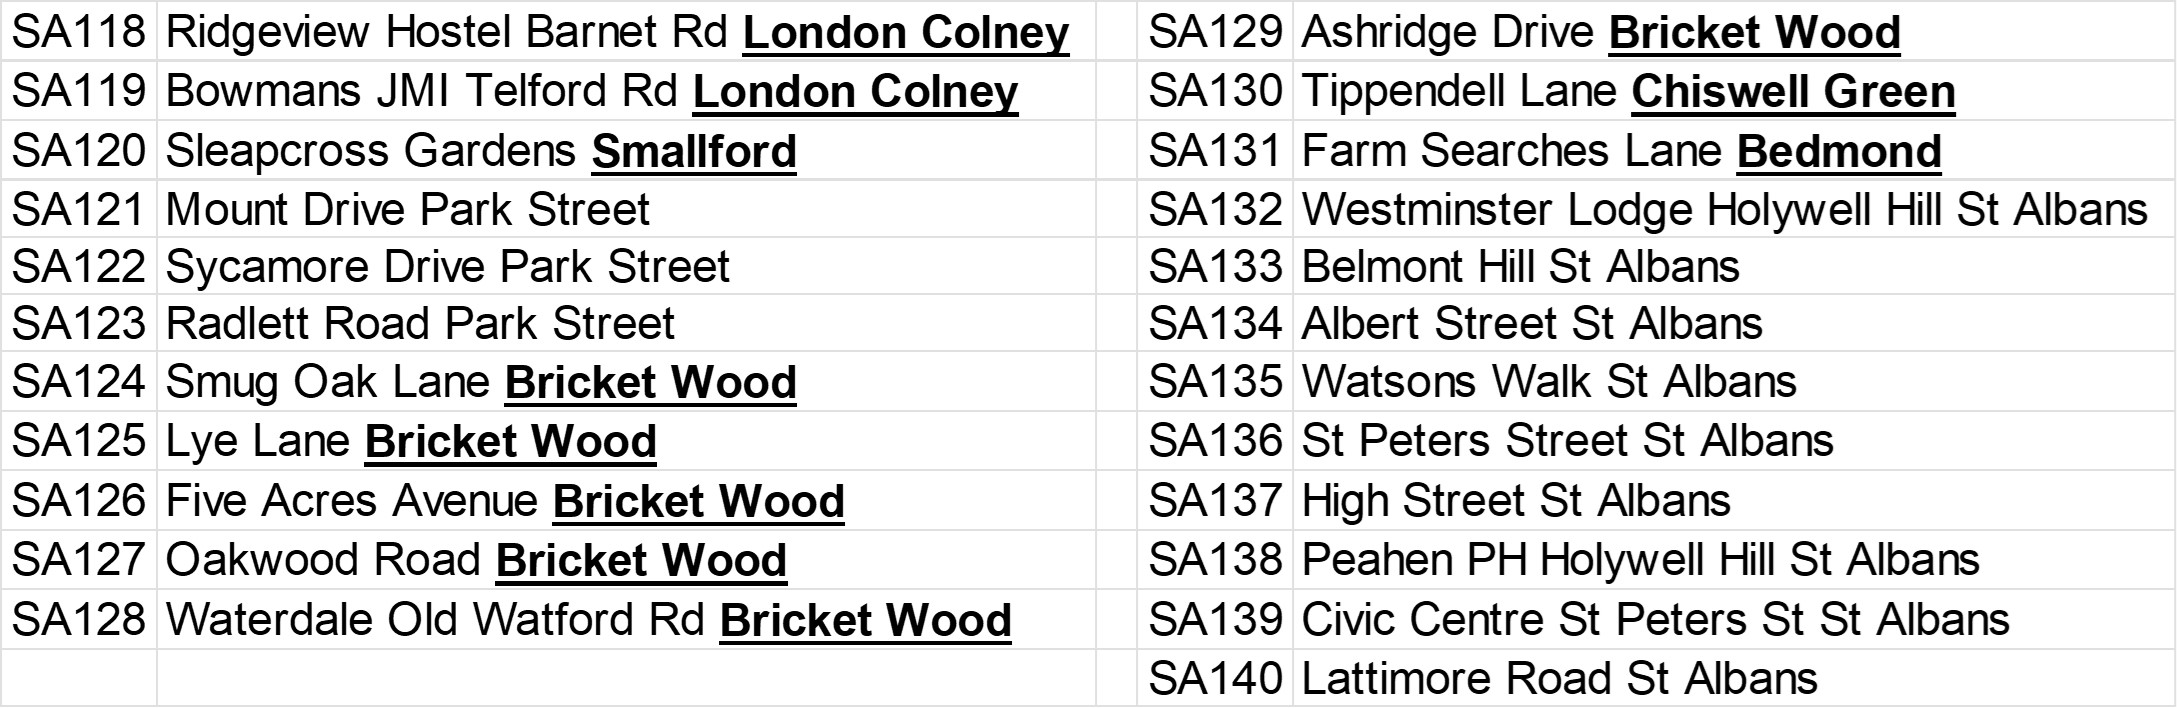
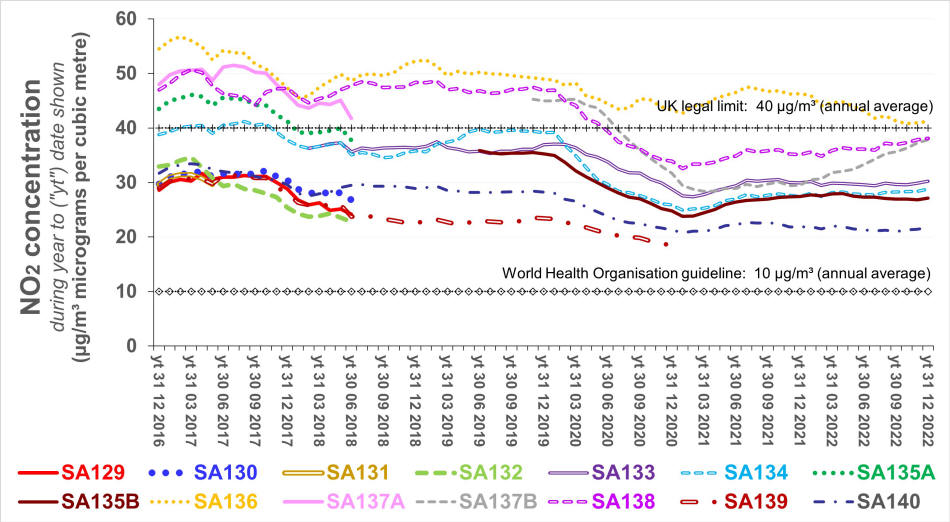
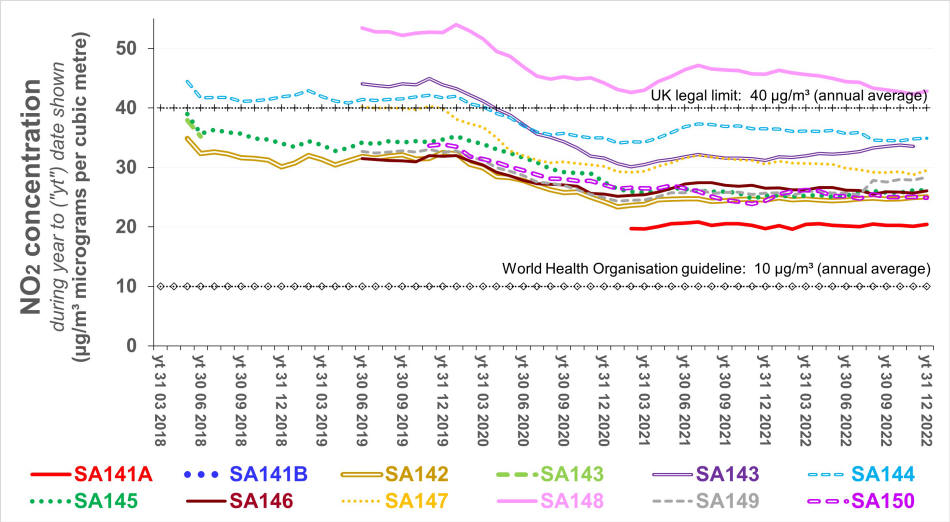
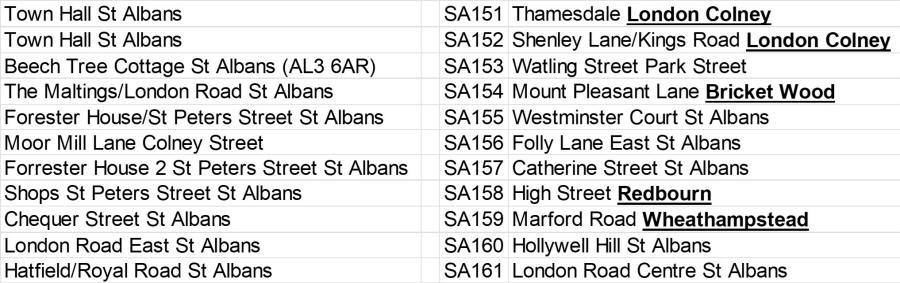
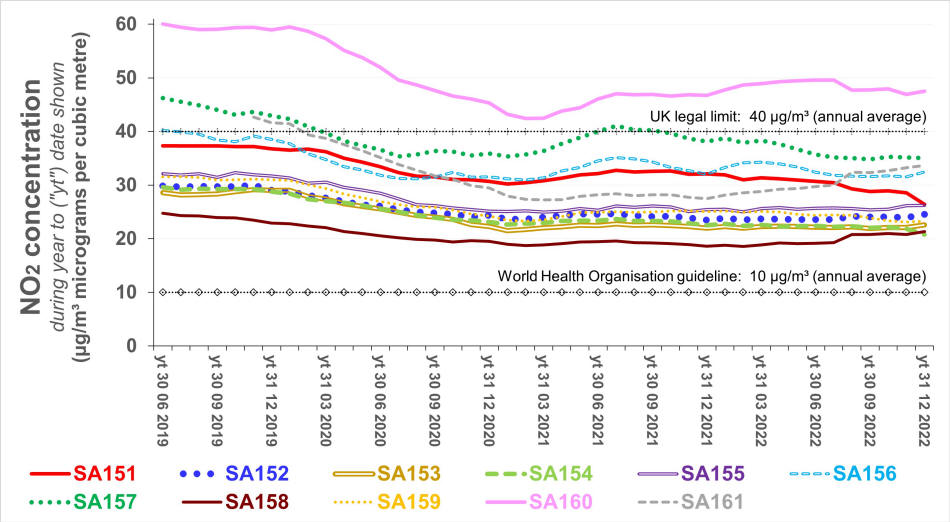
The following charts show how the annual average
concentration of NO2
has changed since 2018 at sites being monitored long-term
using difusion tubes in St Albans and District. The tables
between the charts indicate the location of the sites shown by
(the local authority's) code numbers. This information
derives from the local authority's
Air
Quality Annual Status Reports - which include maps identifying
the sites. The data shown
includes estimates where the local authority data is either
missing or likely to be erroneous. The data shown is "raw" -
it has not been "adjusted for bias". Assuming no bias, annual
average concentrations prior to the end of 2019 considerably
exceed those since 2020. As at the end of 2022, the trend
was upwards at some sites, down at others but generally flat.
For calendar year 2022, most of those concentrations were between
two and three times greater than the World Health Organisation
("WHO") guideline. Those concentrations exceeded the
UK legal limit at three sites and were less than double the WHO
guideline at two sites.
|
|||||
|
For further information, please contact: info@airqualitymatters.uk |
|||||
| Back | |||||