|
AIR QUALITY MATTERS |
|
City of Westminster |
|
"Since
2019 - better for health; ?but not the carbon budget"
|
|
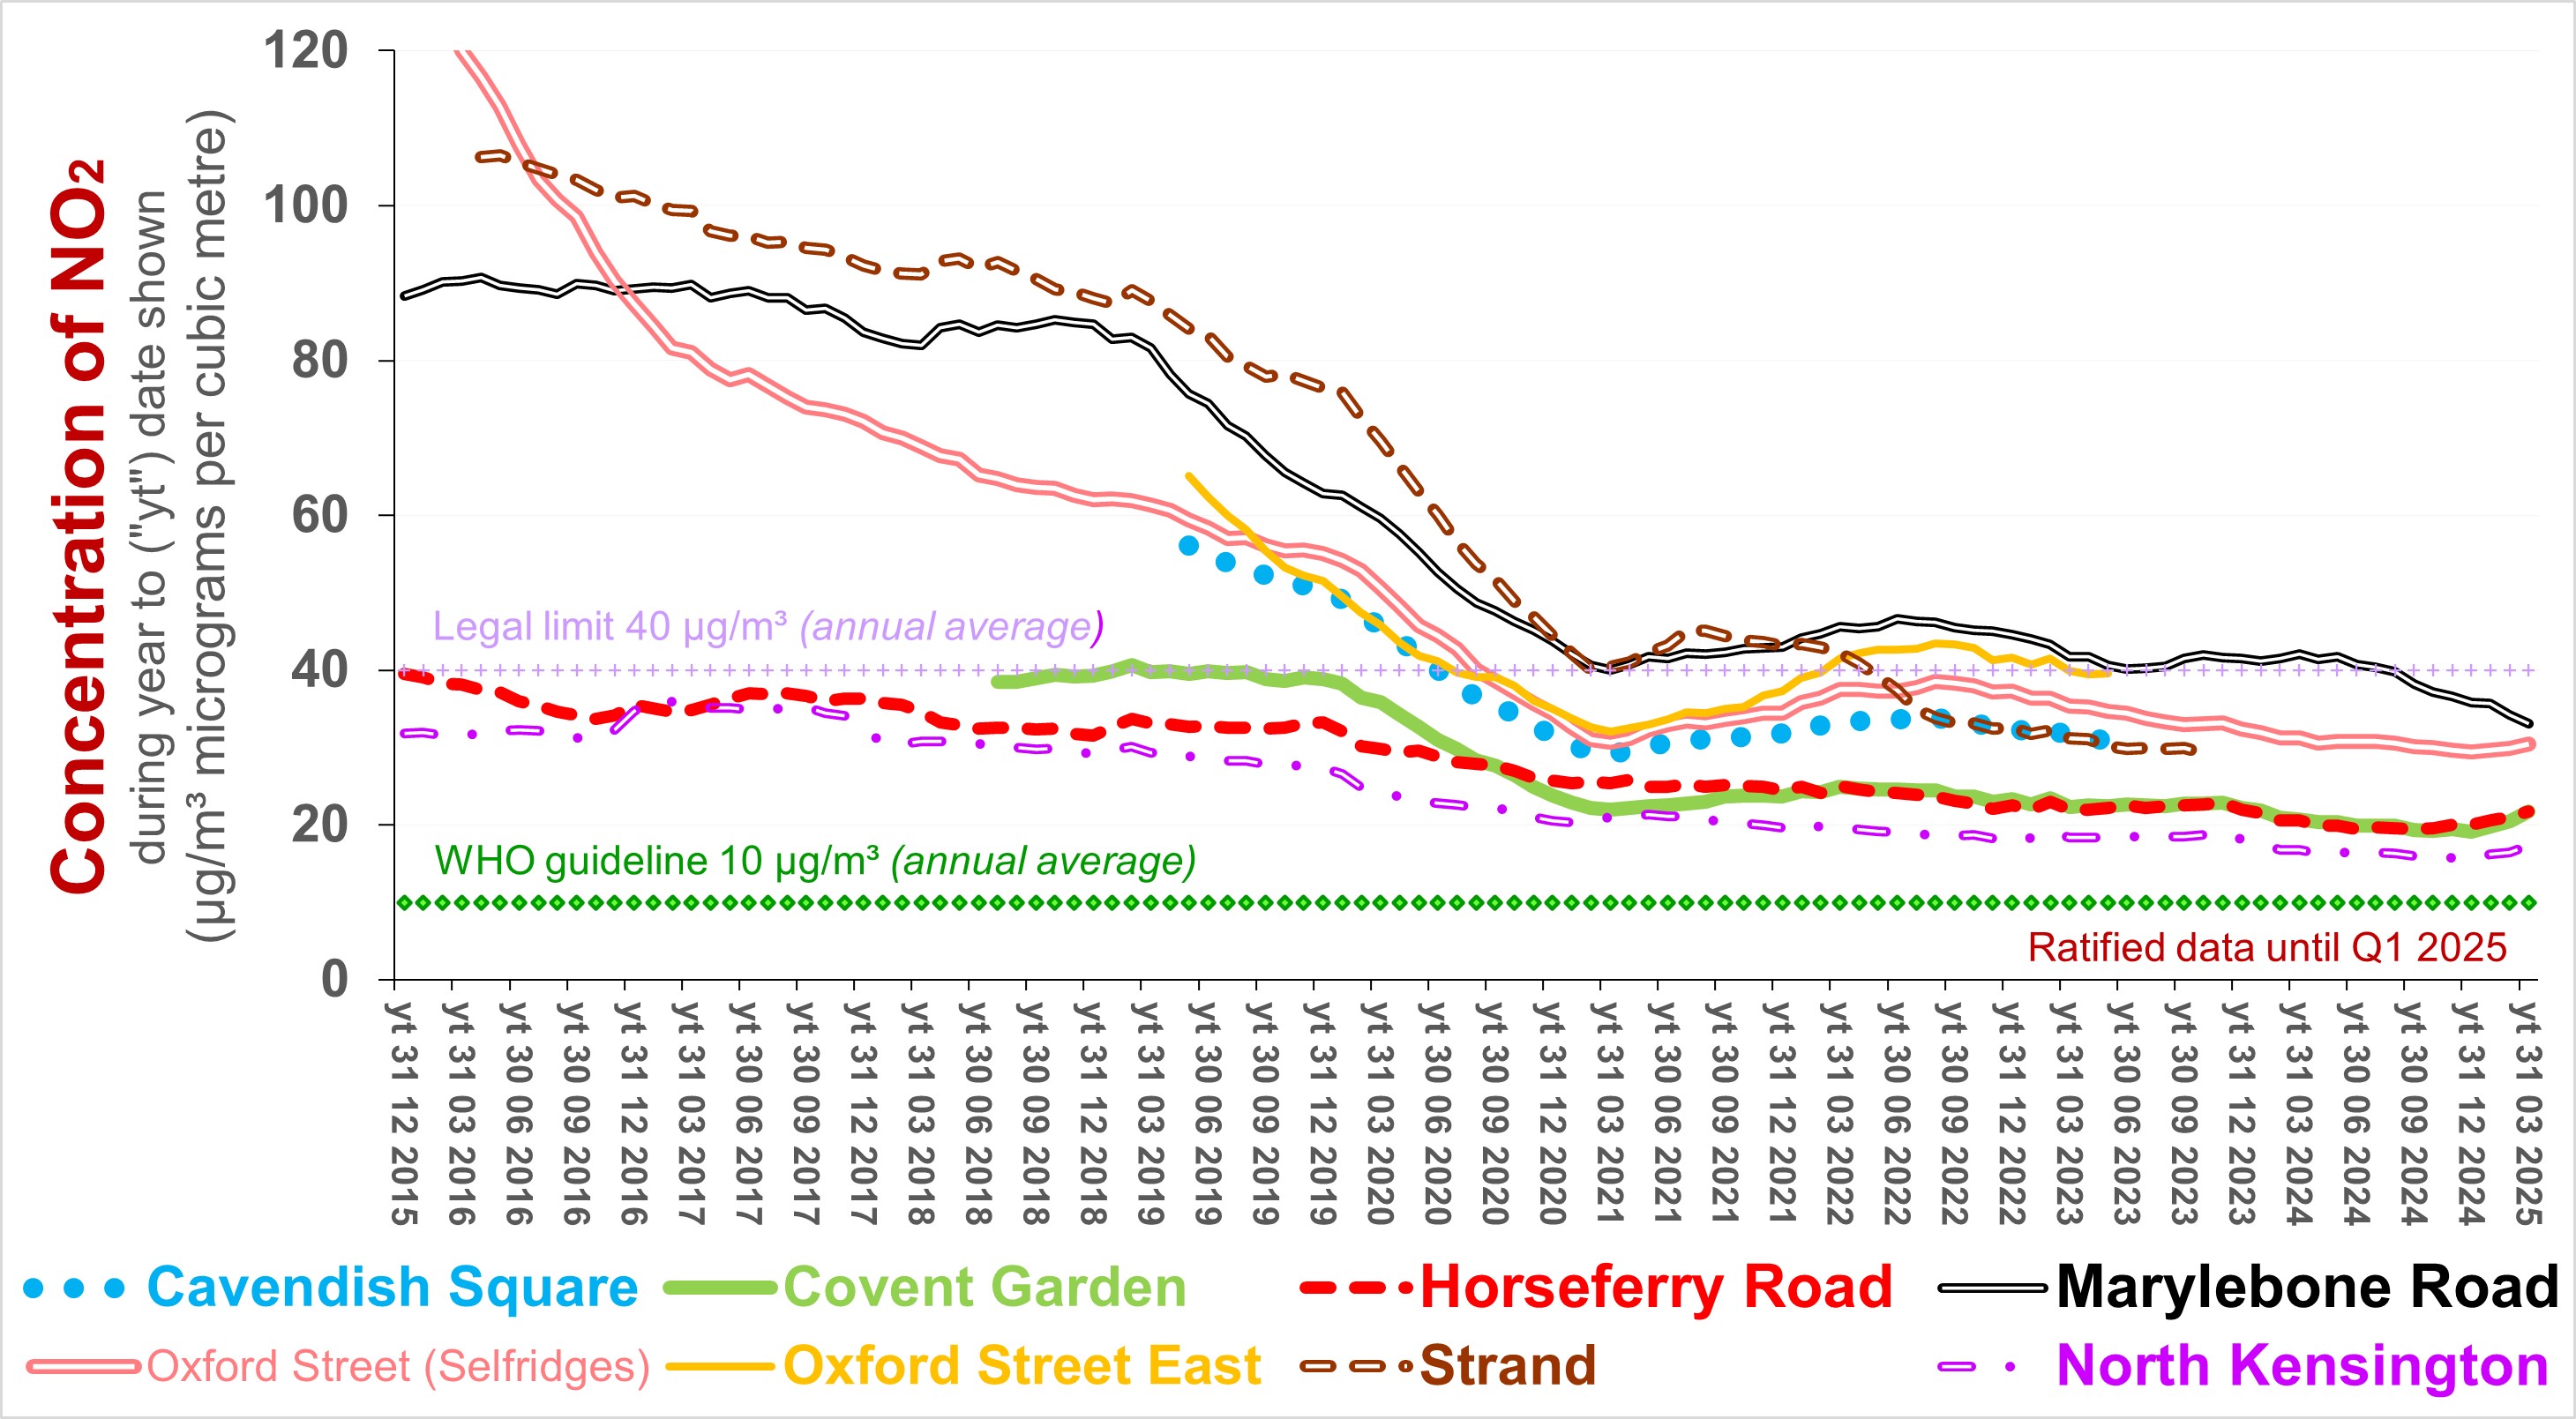
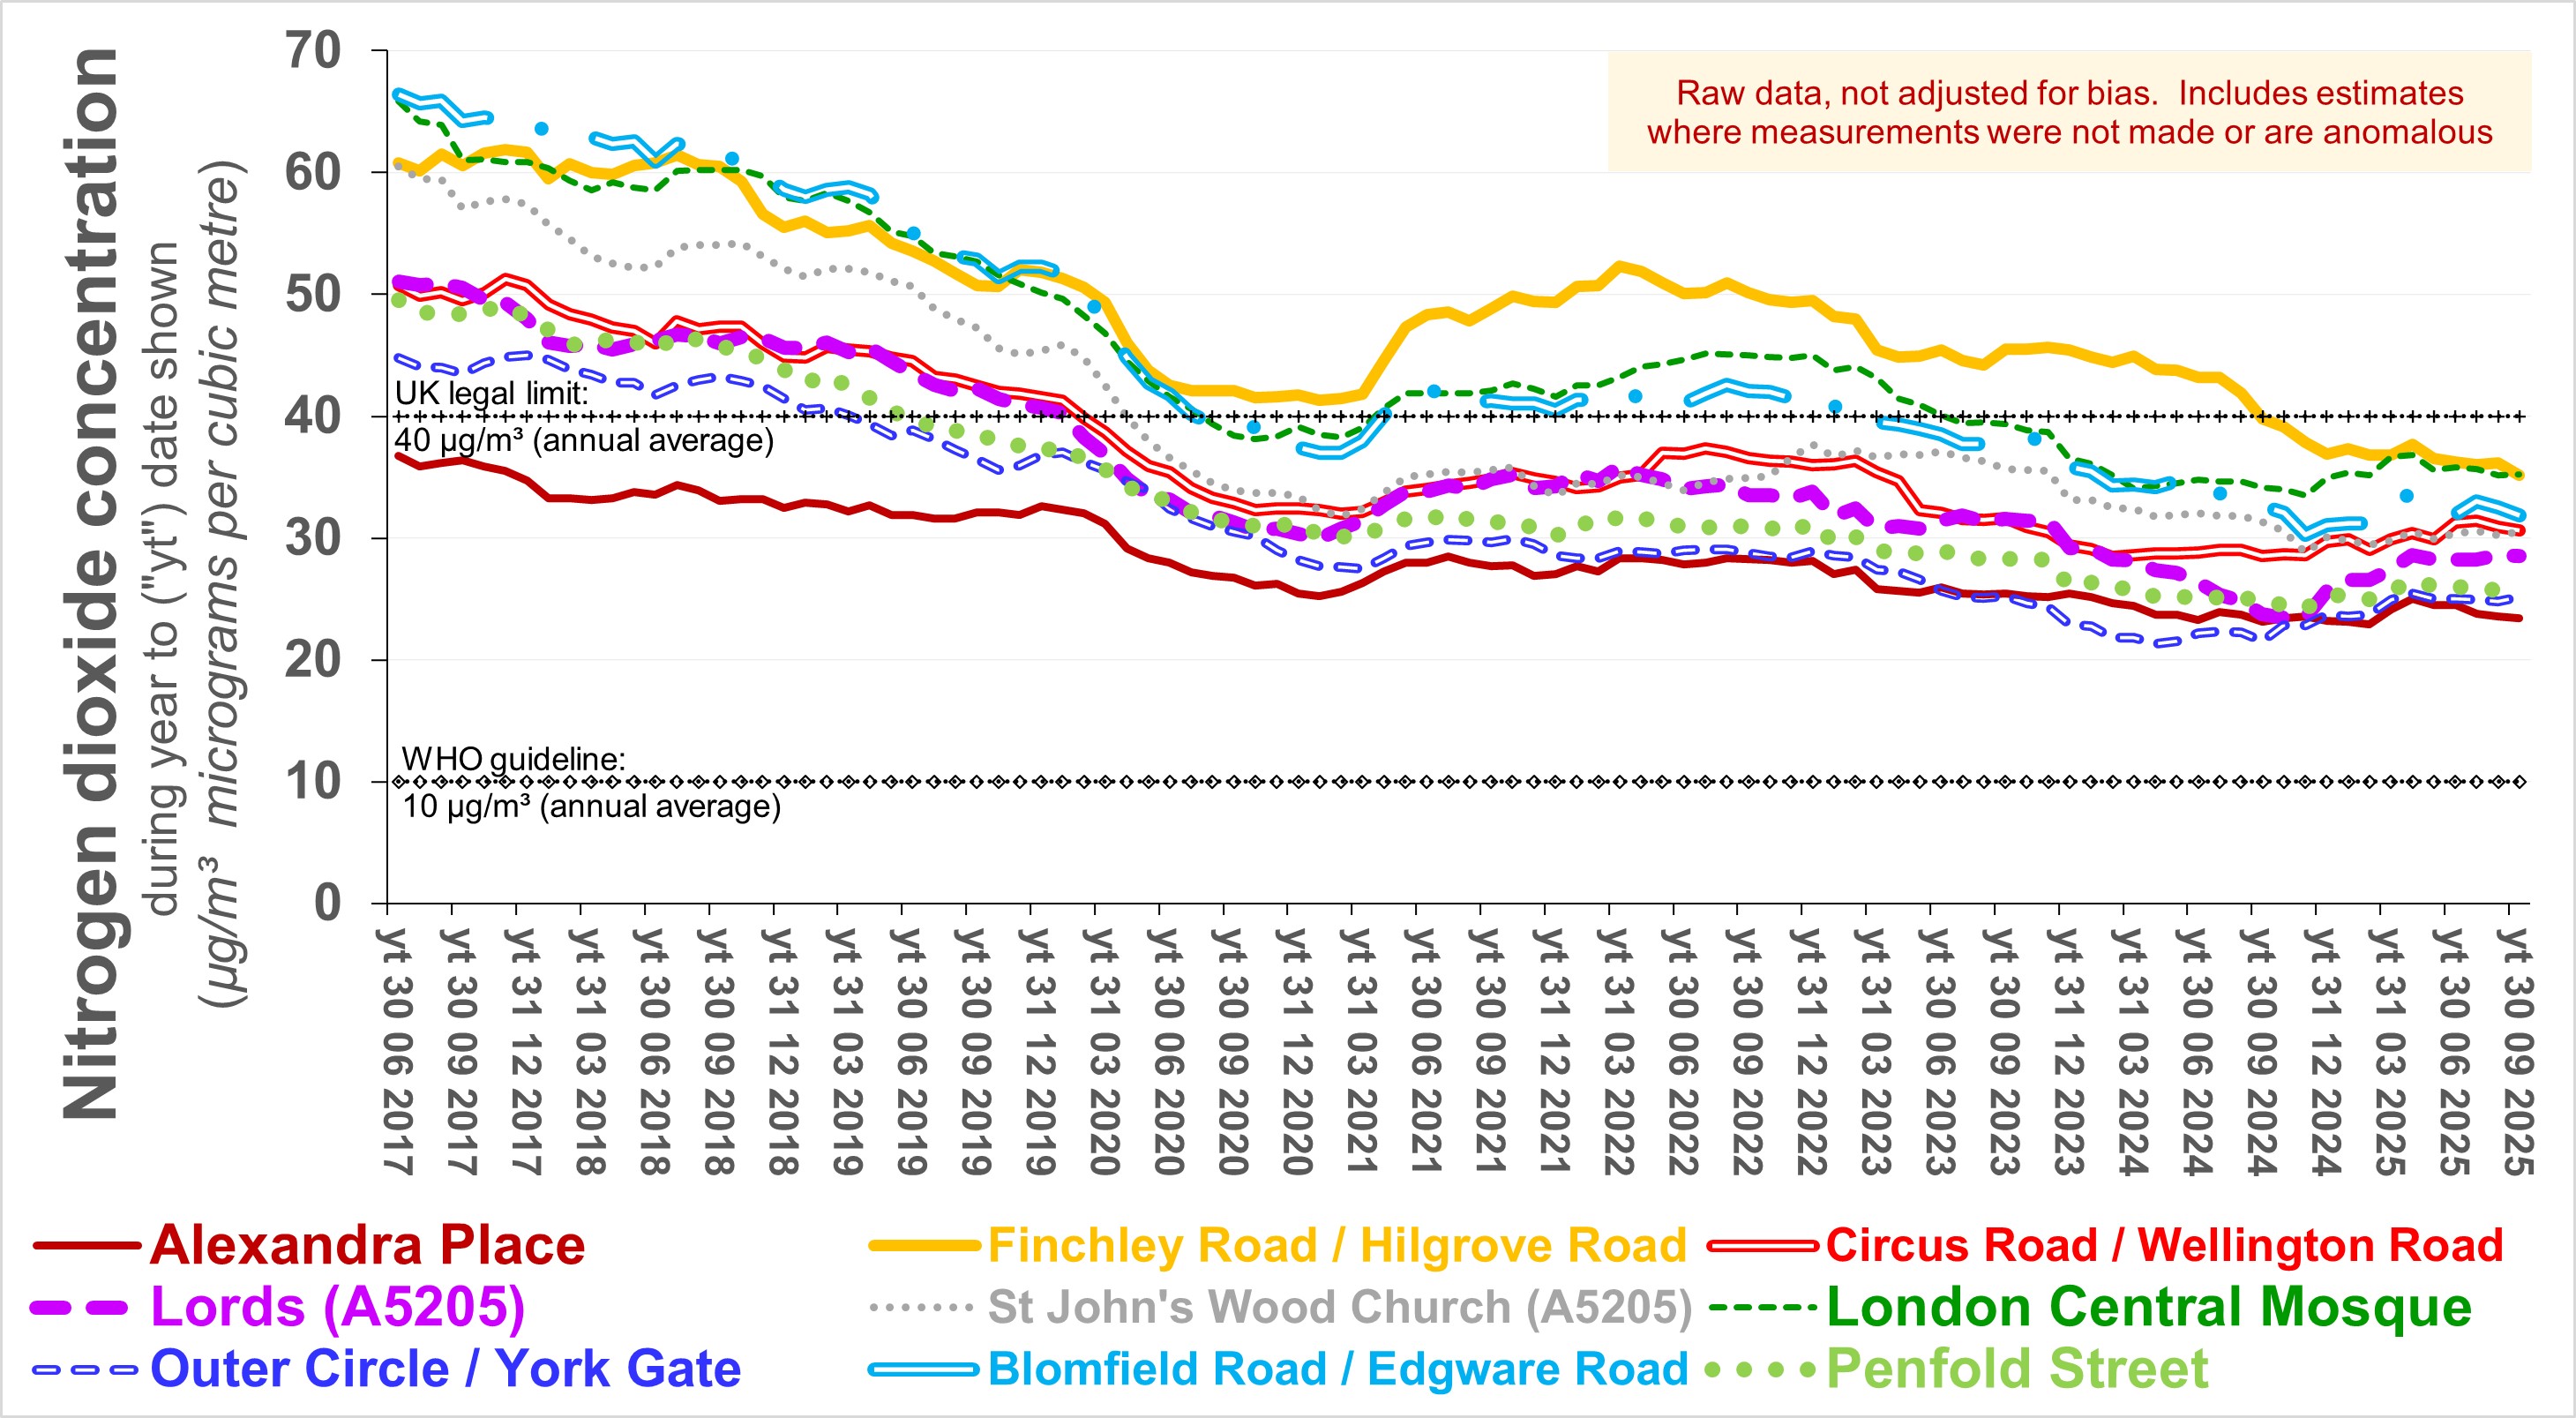
The following chart shows how the
concentration of NO2
(averaged over consecutive periods of 12-months) has changed since 2015 at
some sites in the
City of Westminster where air quality is now being measured
continuously for reference purposes: The steep reduction in NO2 pollution in the vicinity of Selfridges during 2015 and 2016 reflects the success of efforts to revise traffic flows and tighten regulations concerning emissions from buses, taxis and the like. The same can be said about the similar, London-wide improvements during 2019 - but Strand has also been pedestrianised. Responses to the covid-19 pandemic explain the improvement between March 2020 and early 2021. The subsequent trend suggests that the relaxation of those responses has been matched by vehicle users anticipating subsequent phase of the ULEZ. It is unclear why concentrations have continued to decline, in some cases to below what they were (in the same months) during the first covid-lockdown.
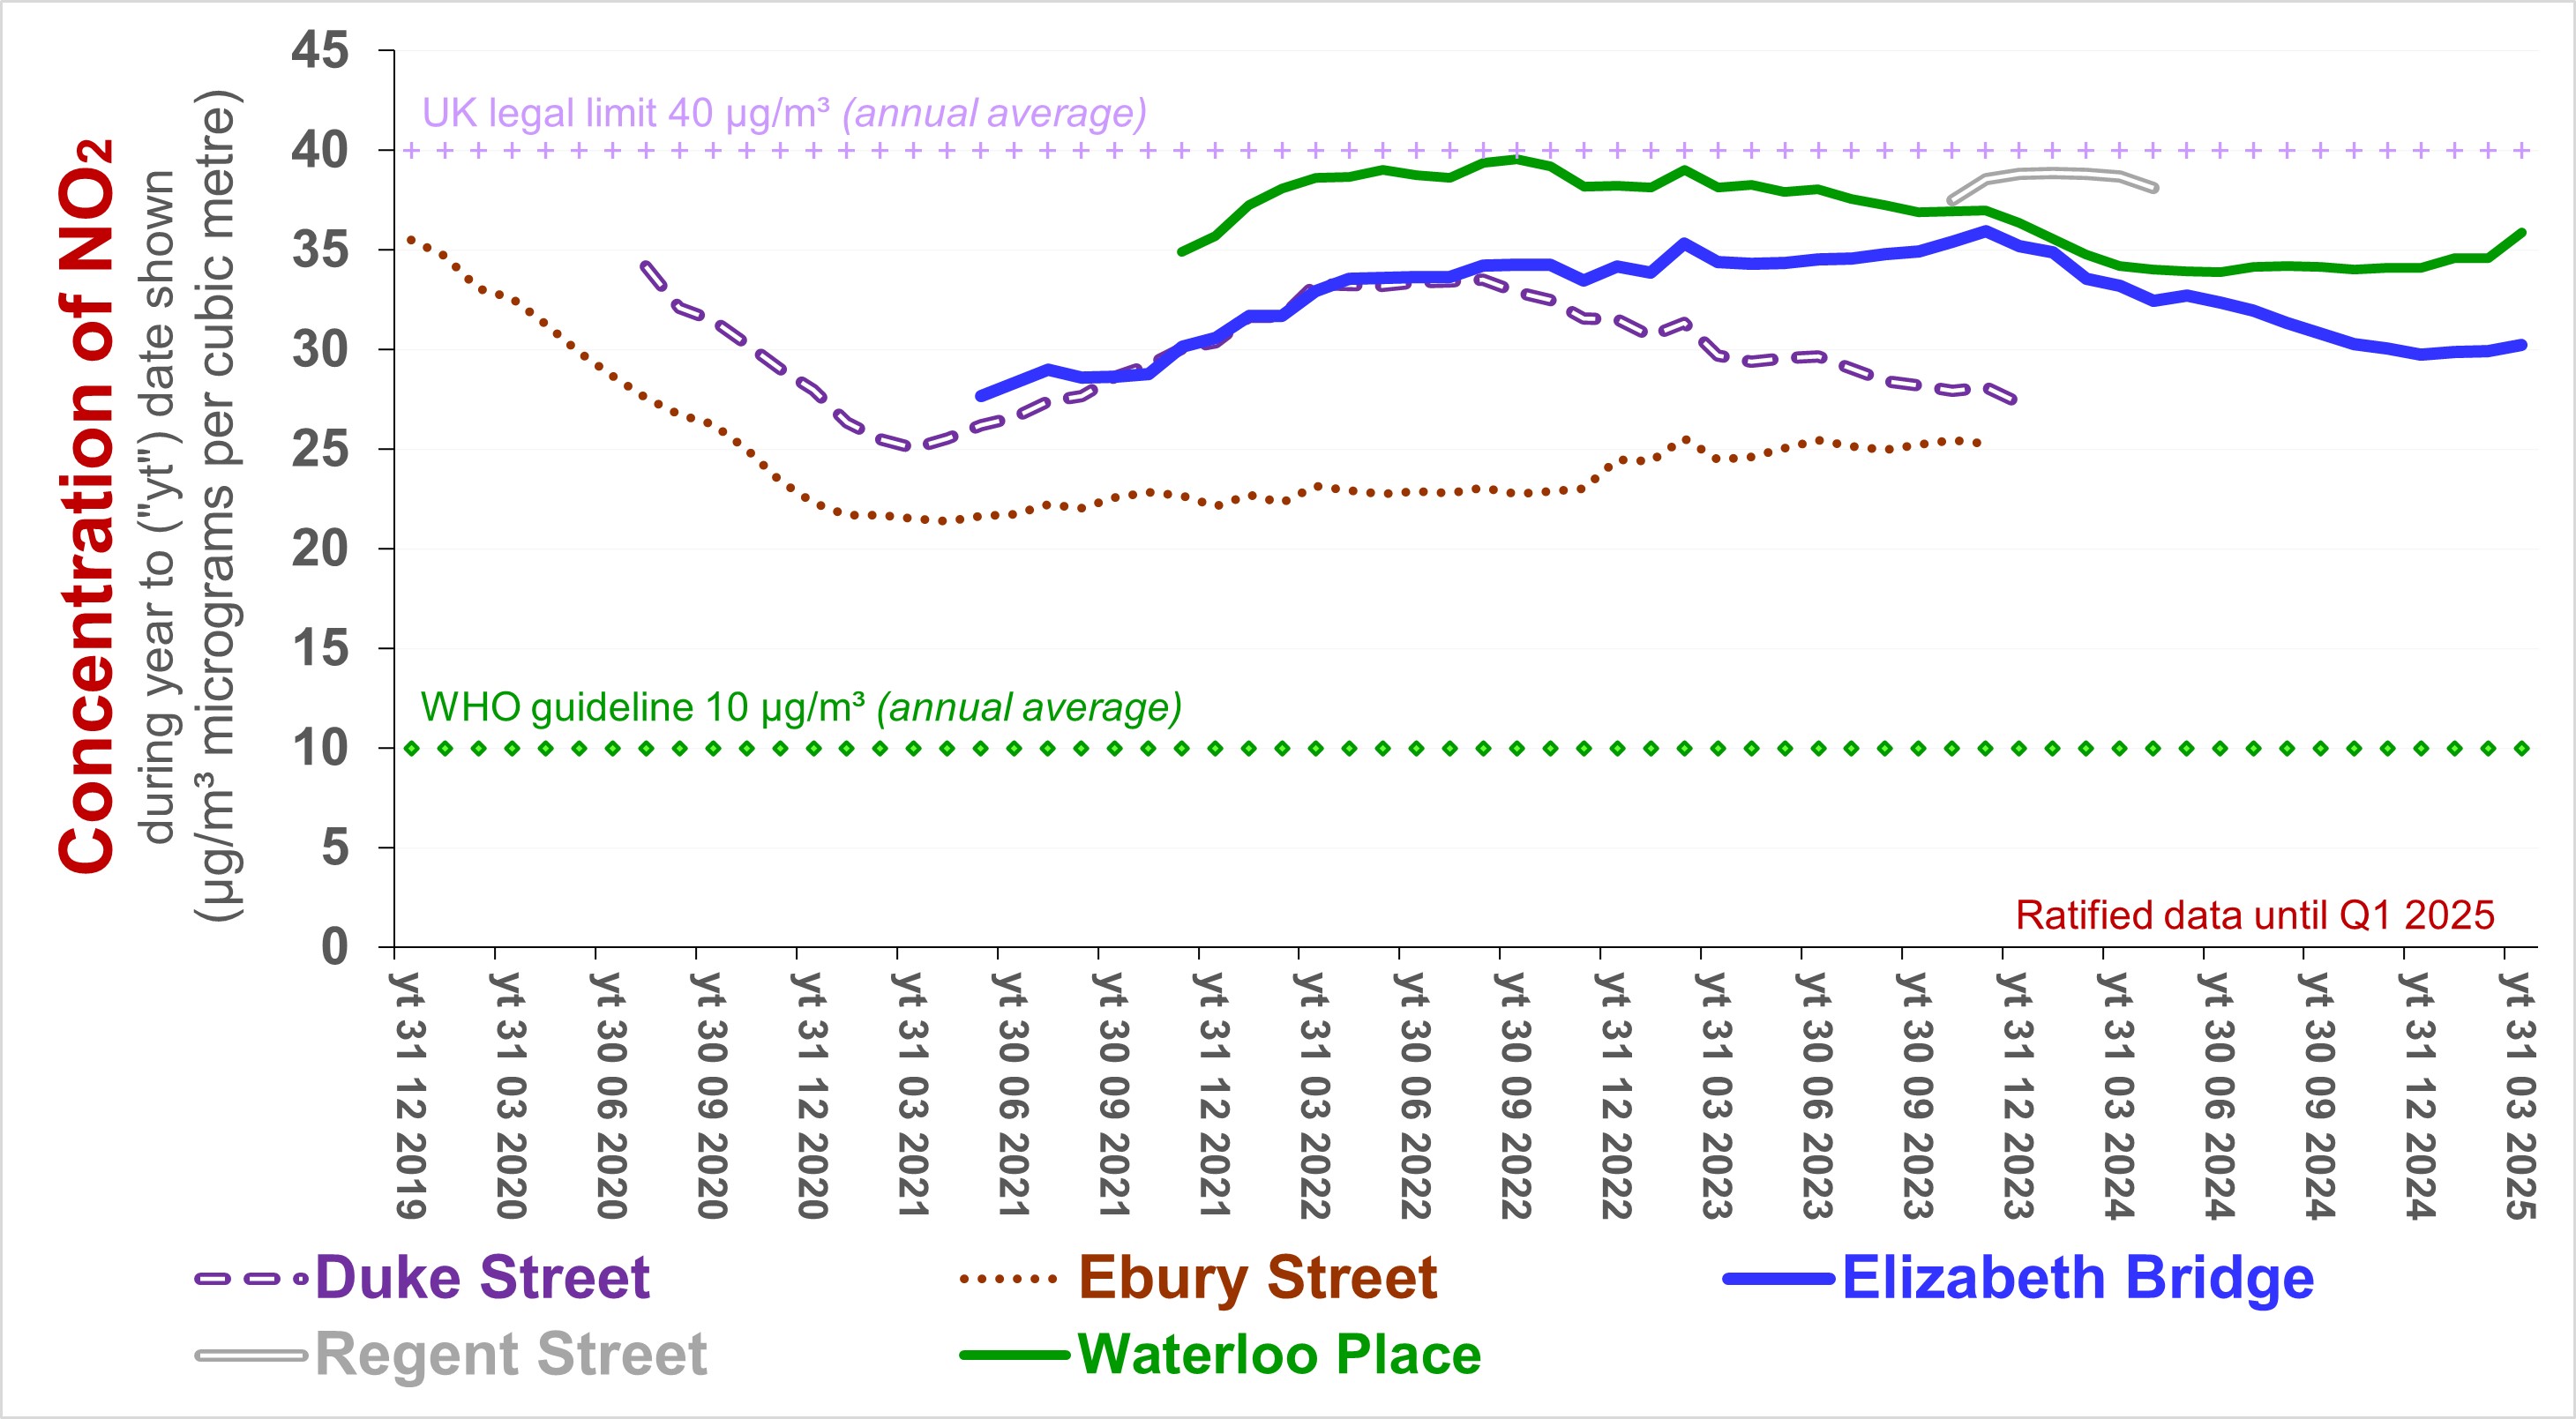
The following chart shows
data similar to the chart above -for other sites in Westminster:
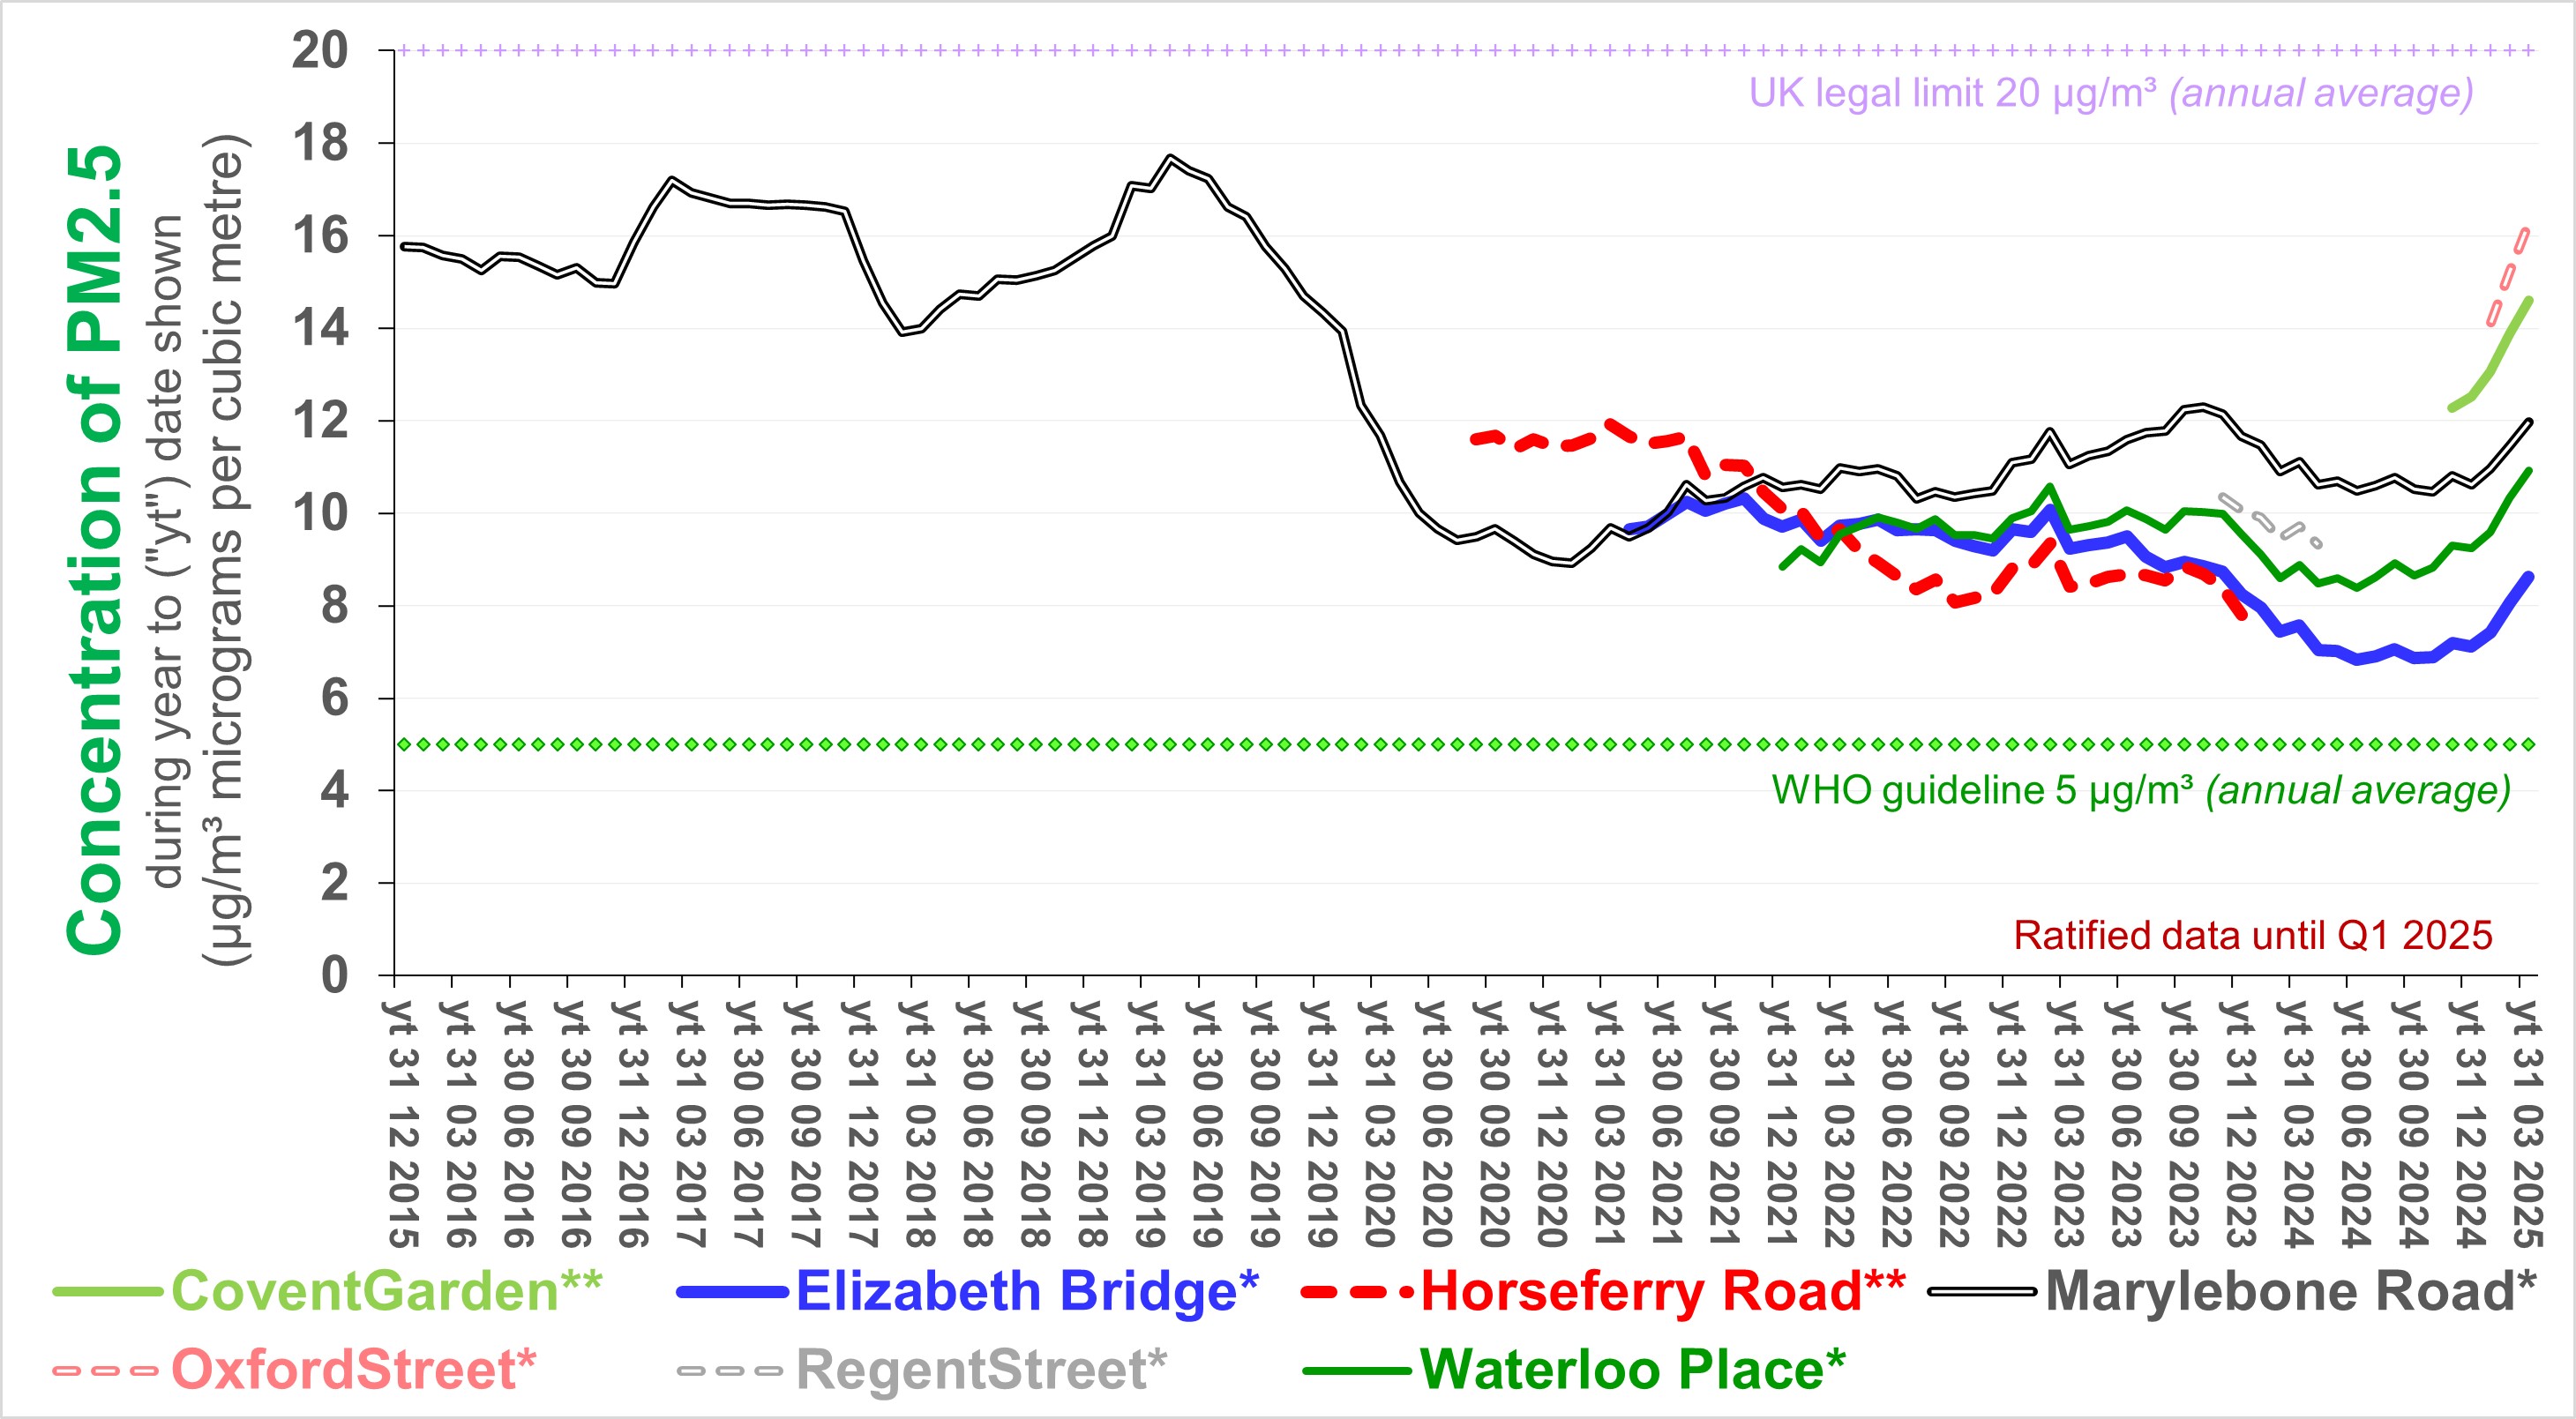
The following chart shows
PM2.5 concentrations measured in Westminster since 2015: The UK government has consulted the public about changing the legal limit for PM2.5 - to double the World Health Organisation guideine, by 2040. This seems to ignore that, even in London, concentrations are already close to 10 μg/m³ and that that target could be achieved by 2030, especially with the right measures and the allocation of sufficient powers to the GLA.
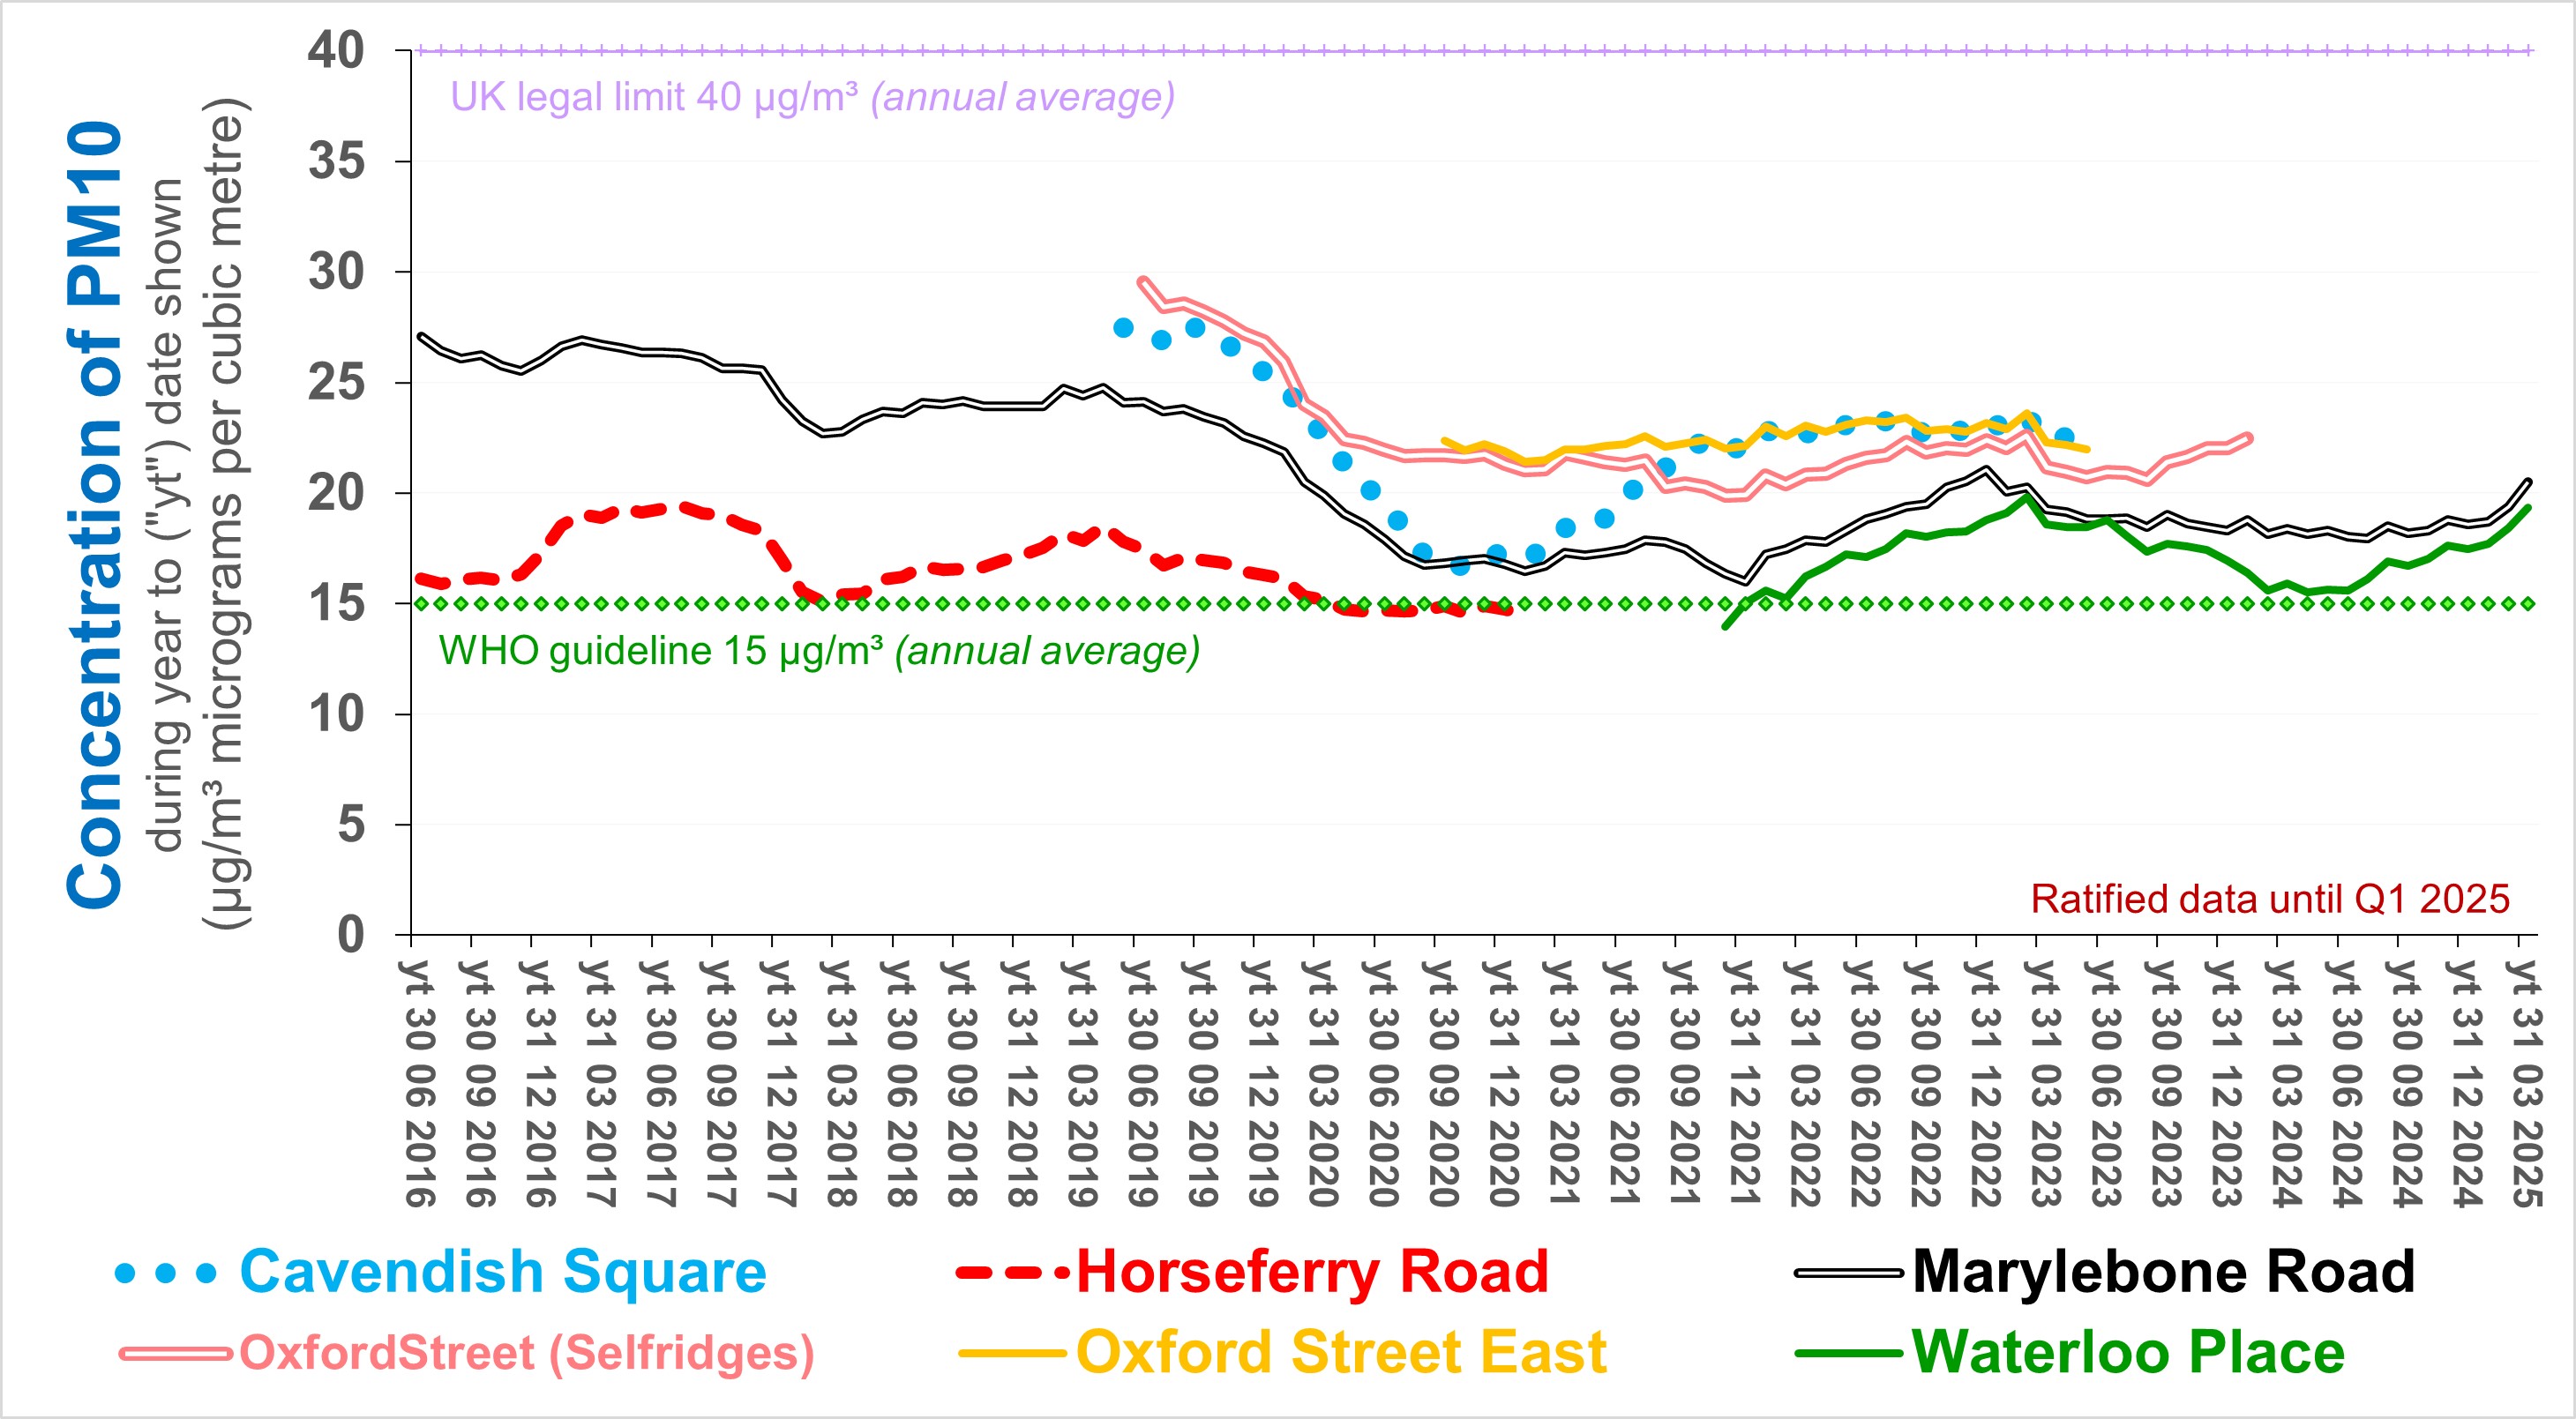
The following chart shows PM10 concentrations measured in Westminster since 2015:
A number of Breathe London sensors are located at sites across Westminster. These set out to monitor both NO2 and PM2.5, but not to reference quality (doing do so - if not connected to the mains - when their solar panels supply their batteries with sufficient energy). Click here for charts deriving from Breathe London Communities. Charts will soon be compiled for sensors deployed by the new Breathe London.
Click here for Westminster City Council NO2 diffusion tube data
Click here for NO2 diffusion tube data measured for HS2
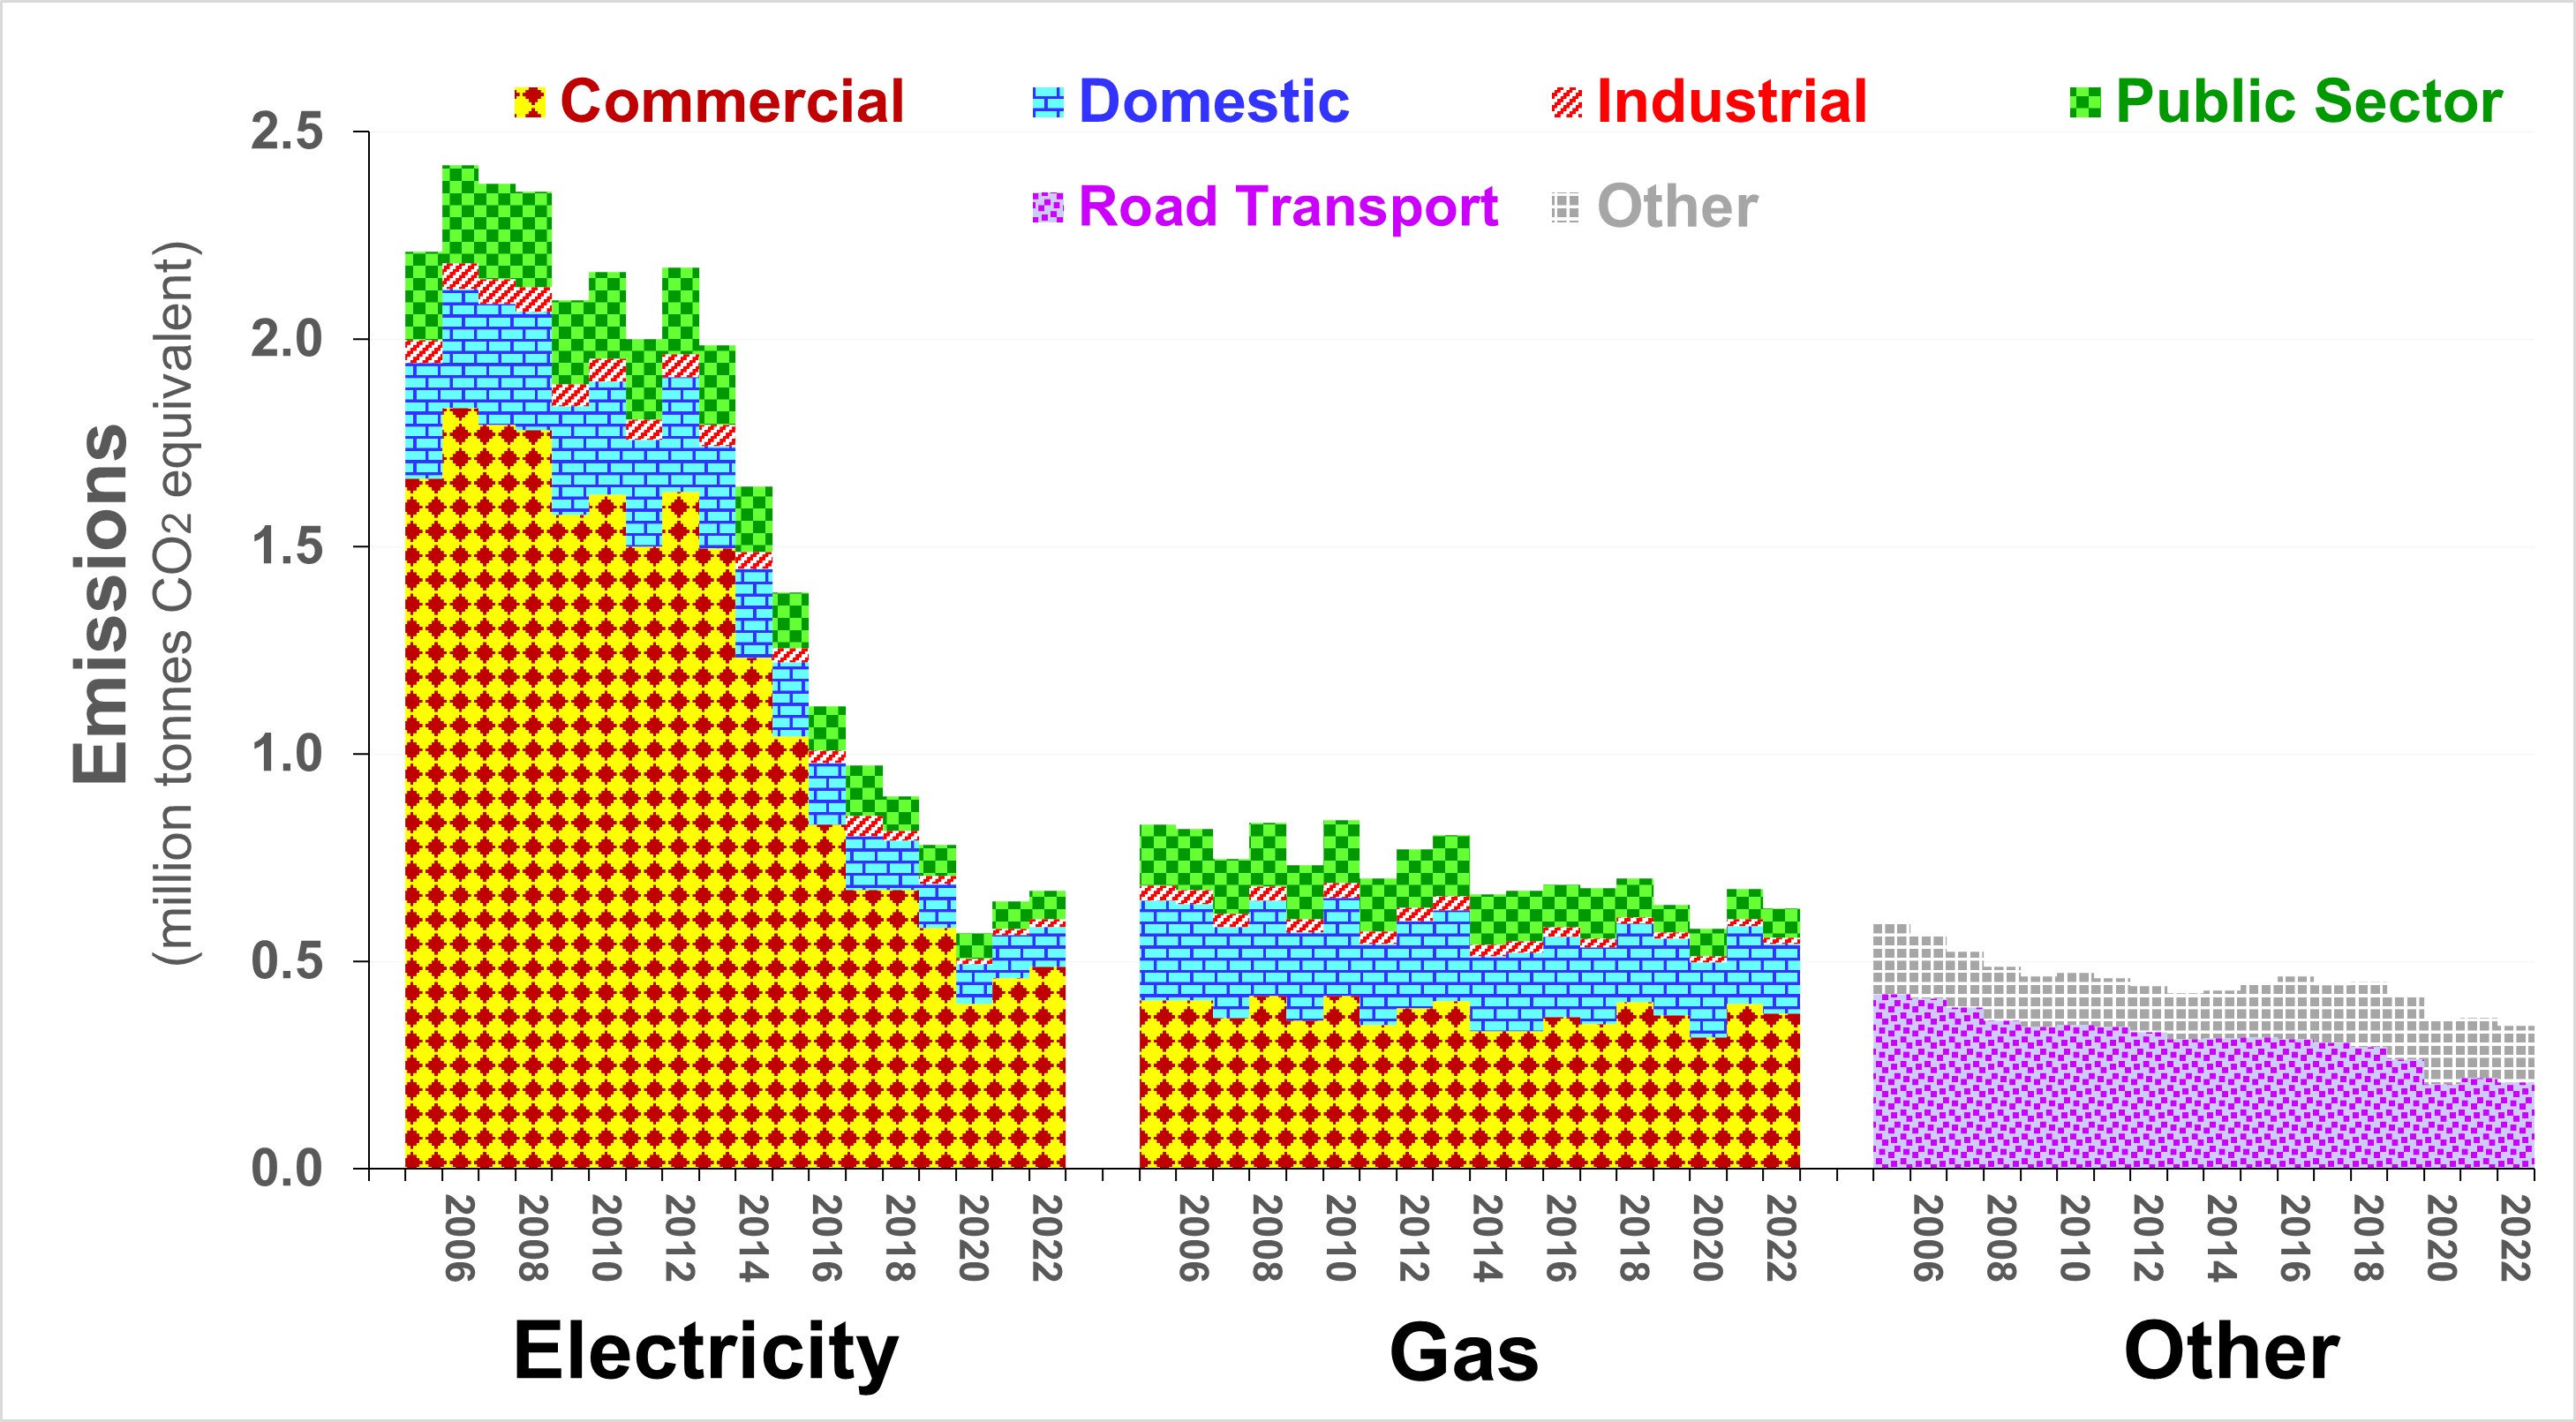
Westminster greenhouse gas emissions Less coal-fired electricity but locking in other carbon-based power; City-wide reduction since 2019: a paltry 10%. Council's estate: c.2% of city-wide emissions.
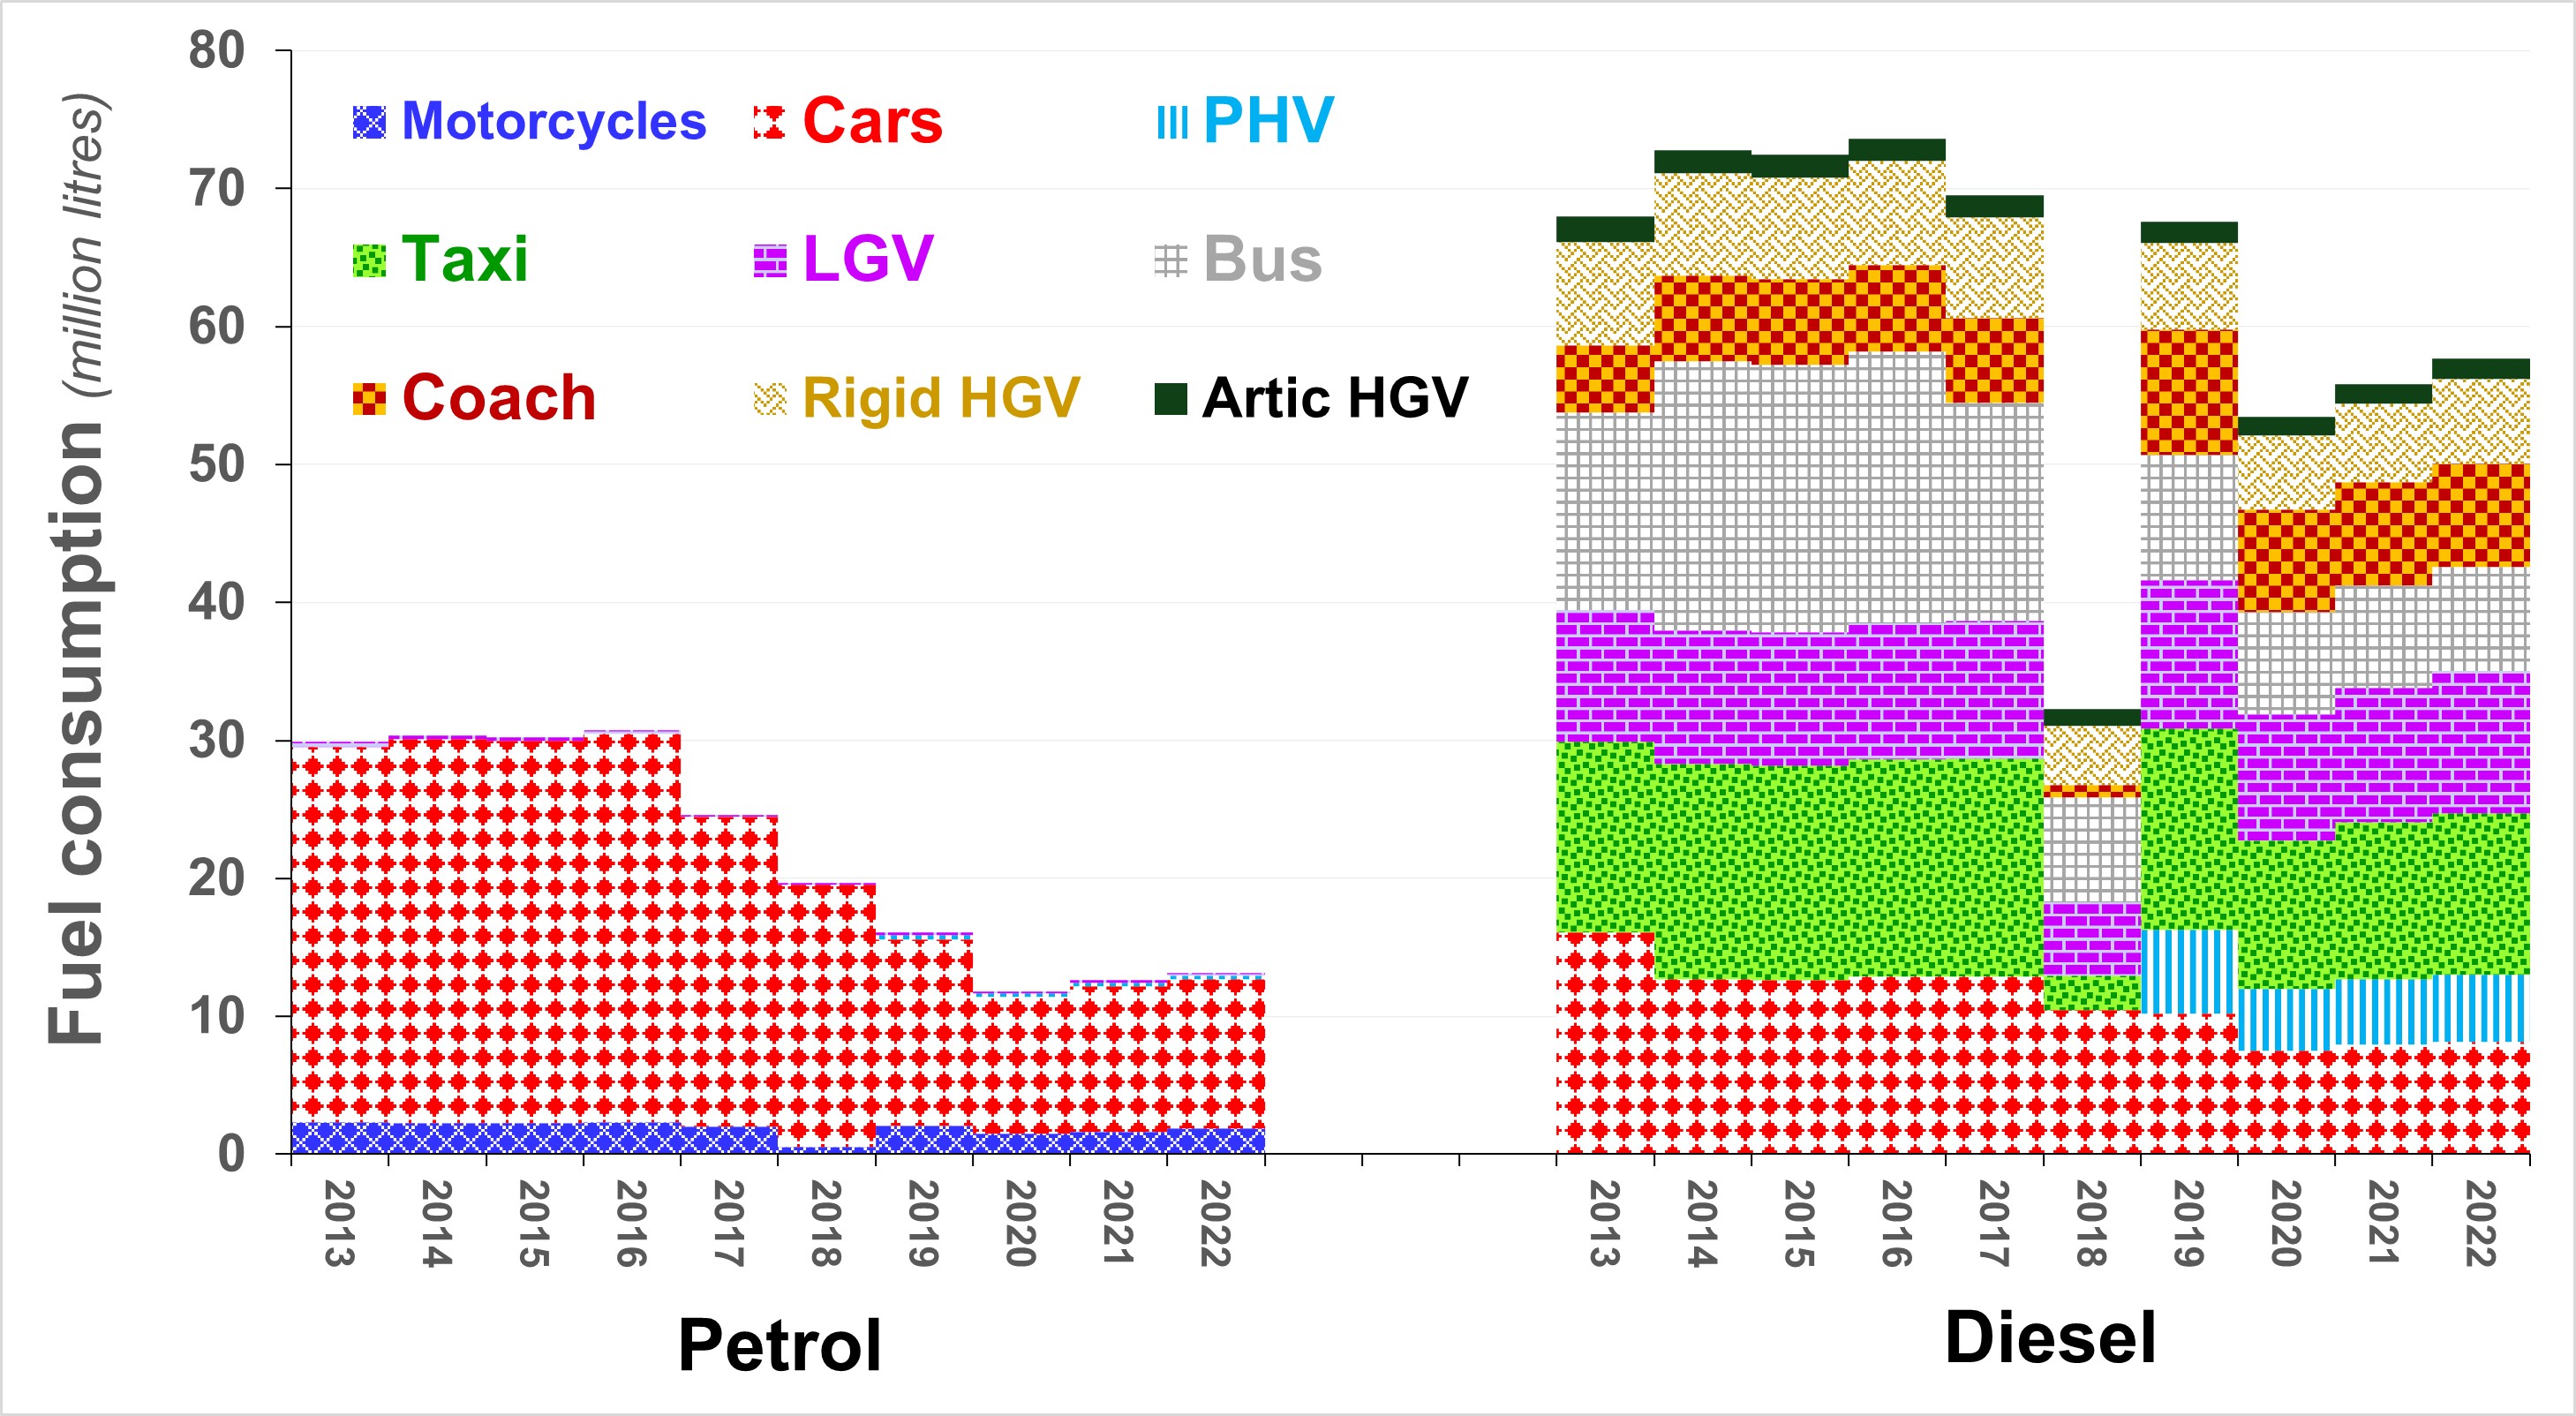
Westminster greenhouse gas emissions from road transport
Westminster City Council stopped sytematically monitoring concentrations of NO2 using diffusion tubes in 2010, the year by which those concentrations should have declined to less than the legal limit (40 micrograms per cubic metre). On the recommendation of both DEFRA and the GLA, the Council has re-started. However, November 2020 is the first month for which measurements have been published, earlier months seeming to have been spent testing diffusion tubes from at least one other supplier. It is standard practice across local authorities in London to publish such data in Air Quality Annual Status Reports for the given calendar year - but only after approval by the GLA and DEFRA. During recent years, approval has taken several months longer than it used to. This tends to reflect lack of government committment, despite ever increasing evidence of the health, social and economic costs of air polution, and despite the climate emergency. The current time lag of 18 months to two years is inexcusable. NO2 concentrations are an important, albeit weak, proxy for greenhouse gas emissions in so far as NO2 in urban areas derives predominaoty from combustion in diesel vehicles and methane ("natural" gas) for heating and cooking. As such, local authorities should publish - on an explicitly provisional basis - their NO2 diffusion tube measurements within two months of the end of the period during which the tubes are exposed.
Click
here for a map of NO2 concentrations (?in 2017) across the
Oxford Street District.
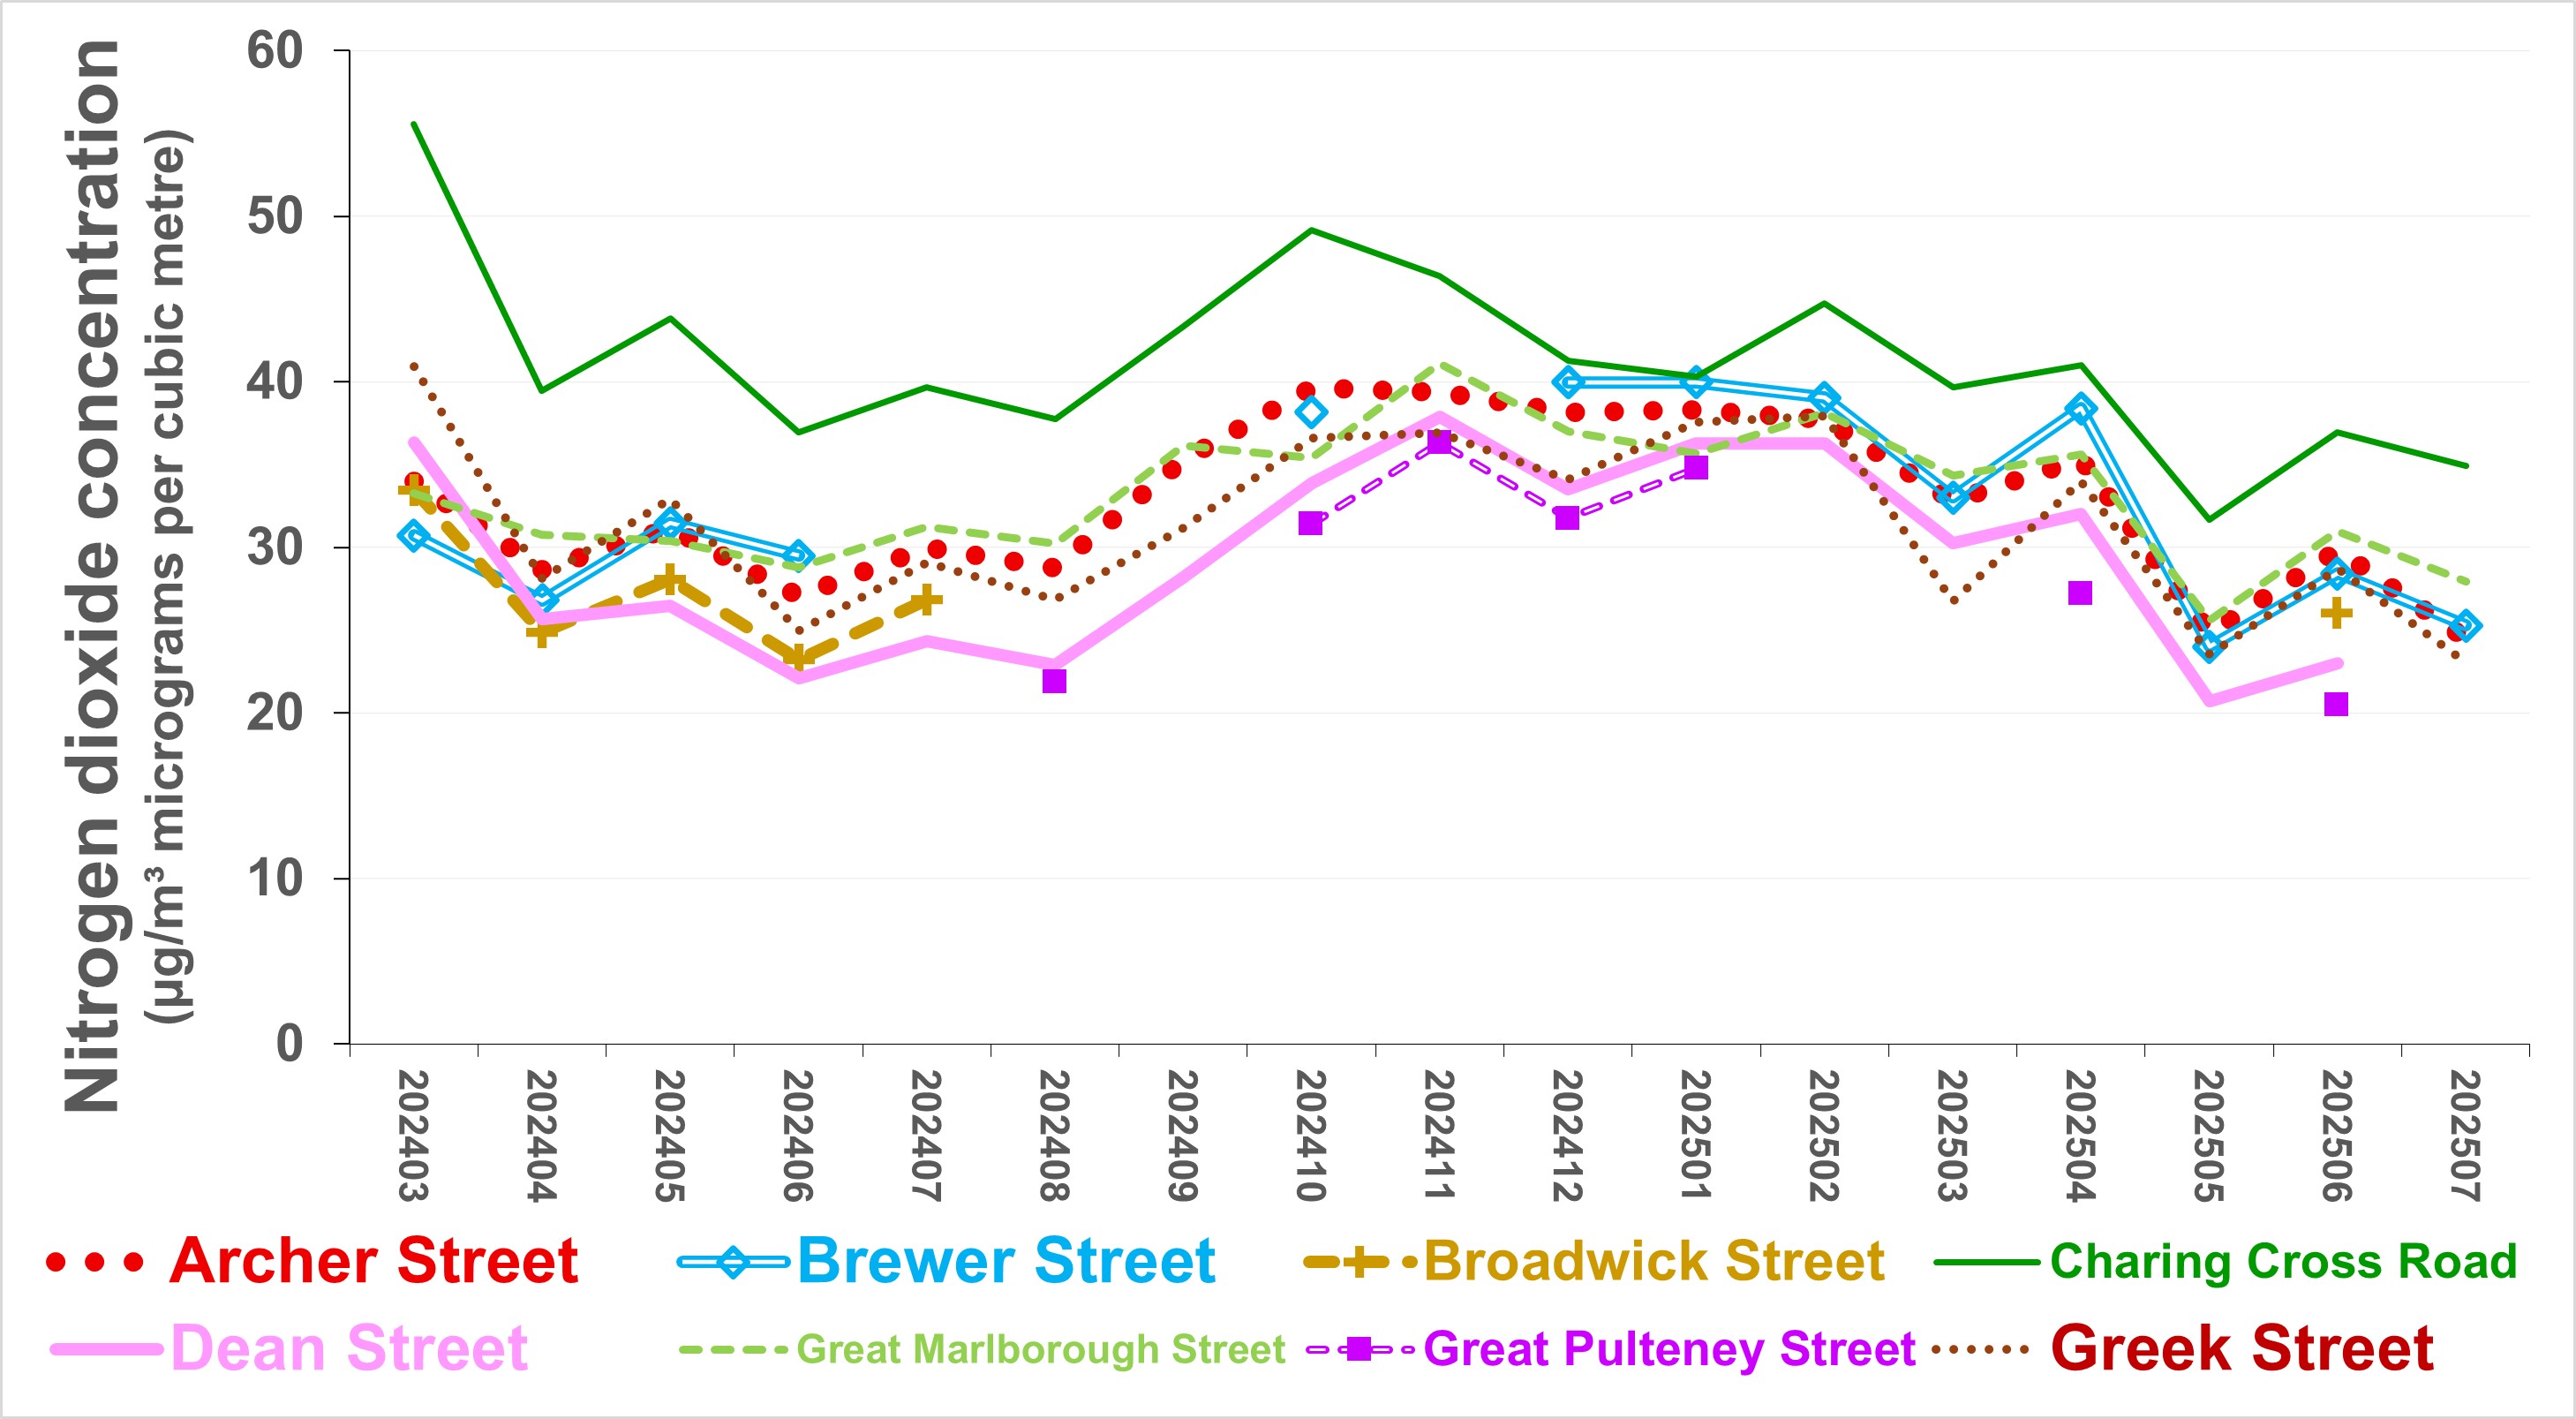
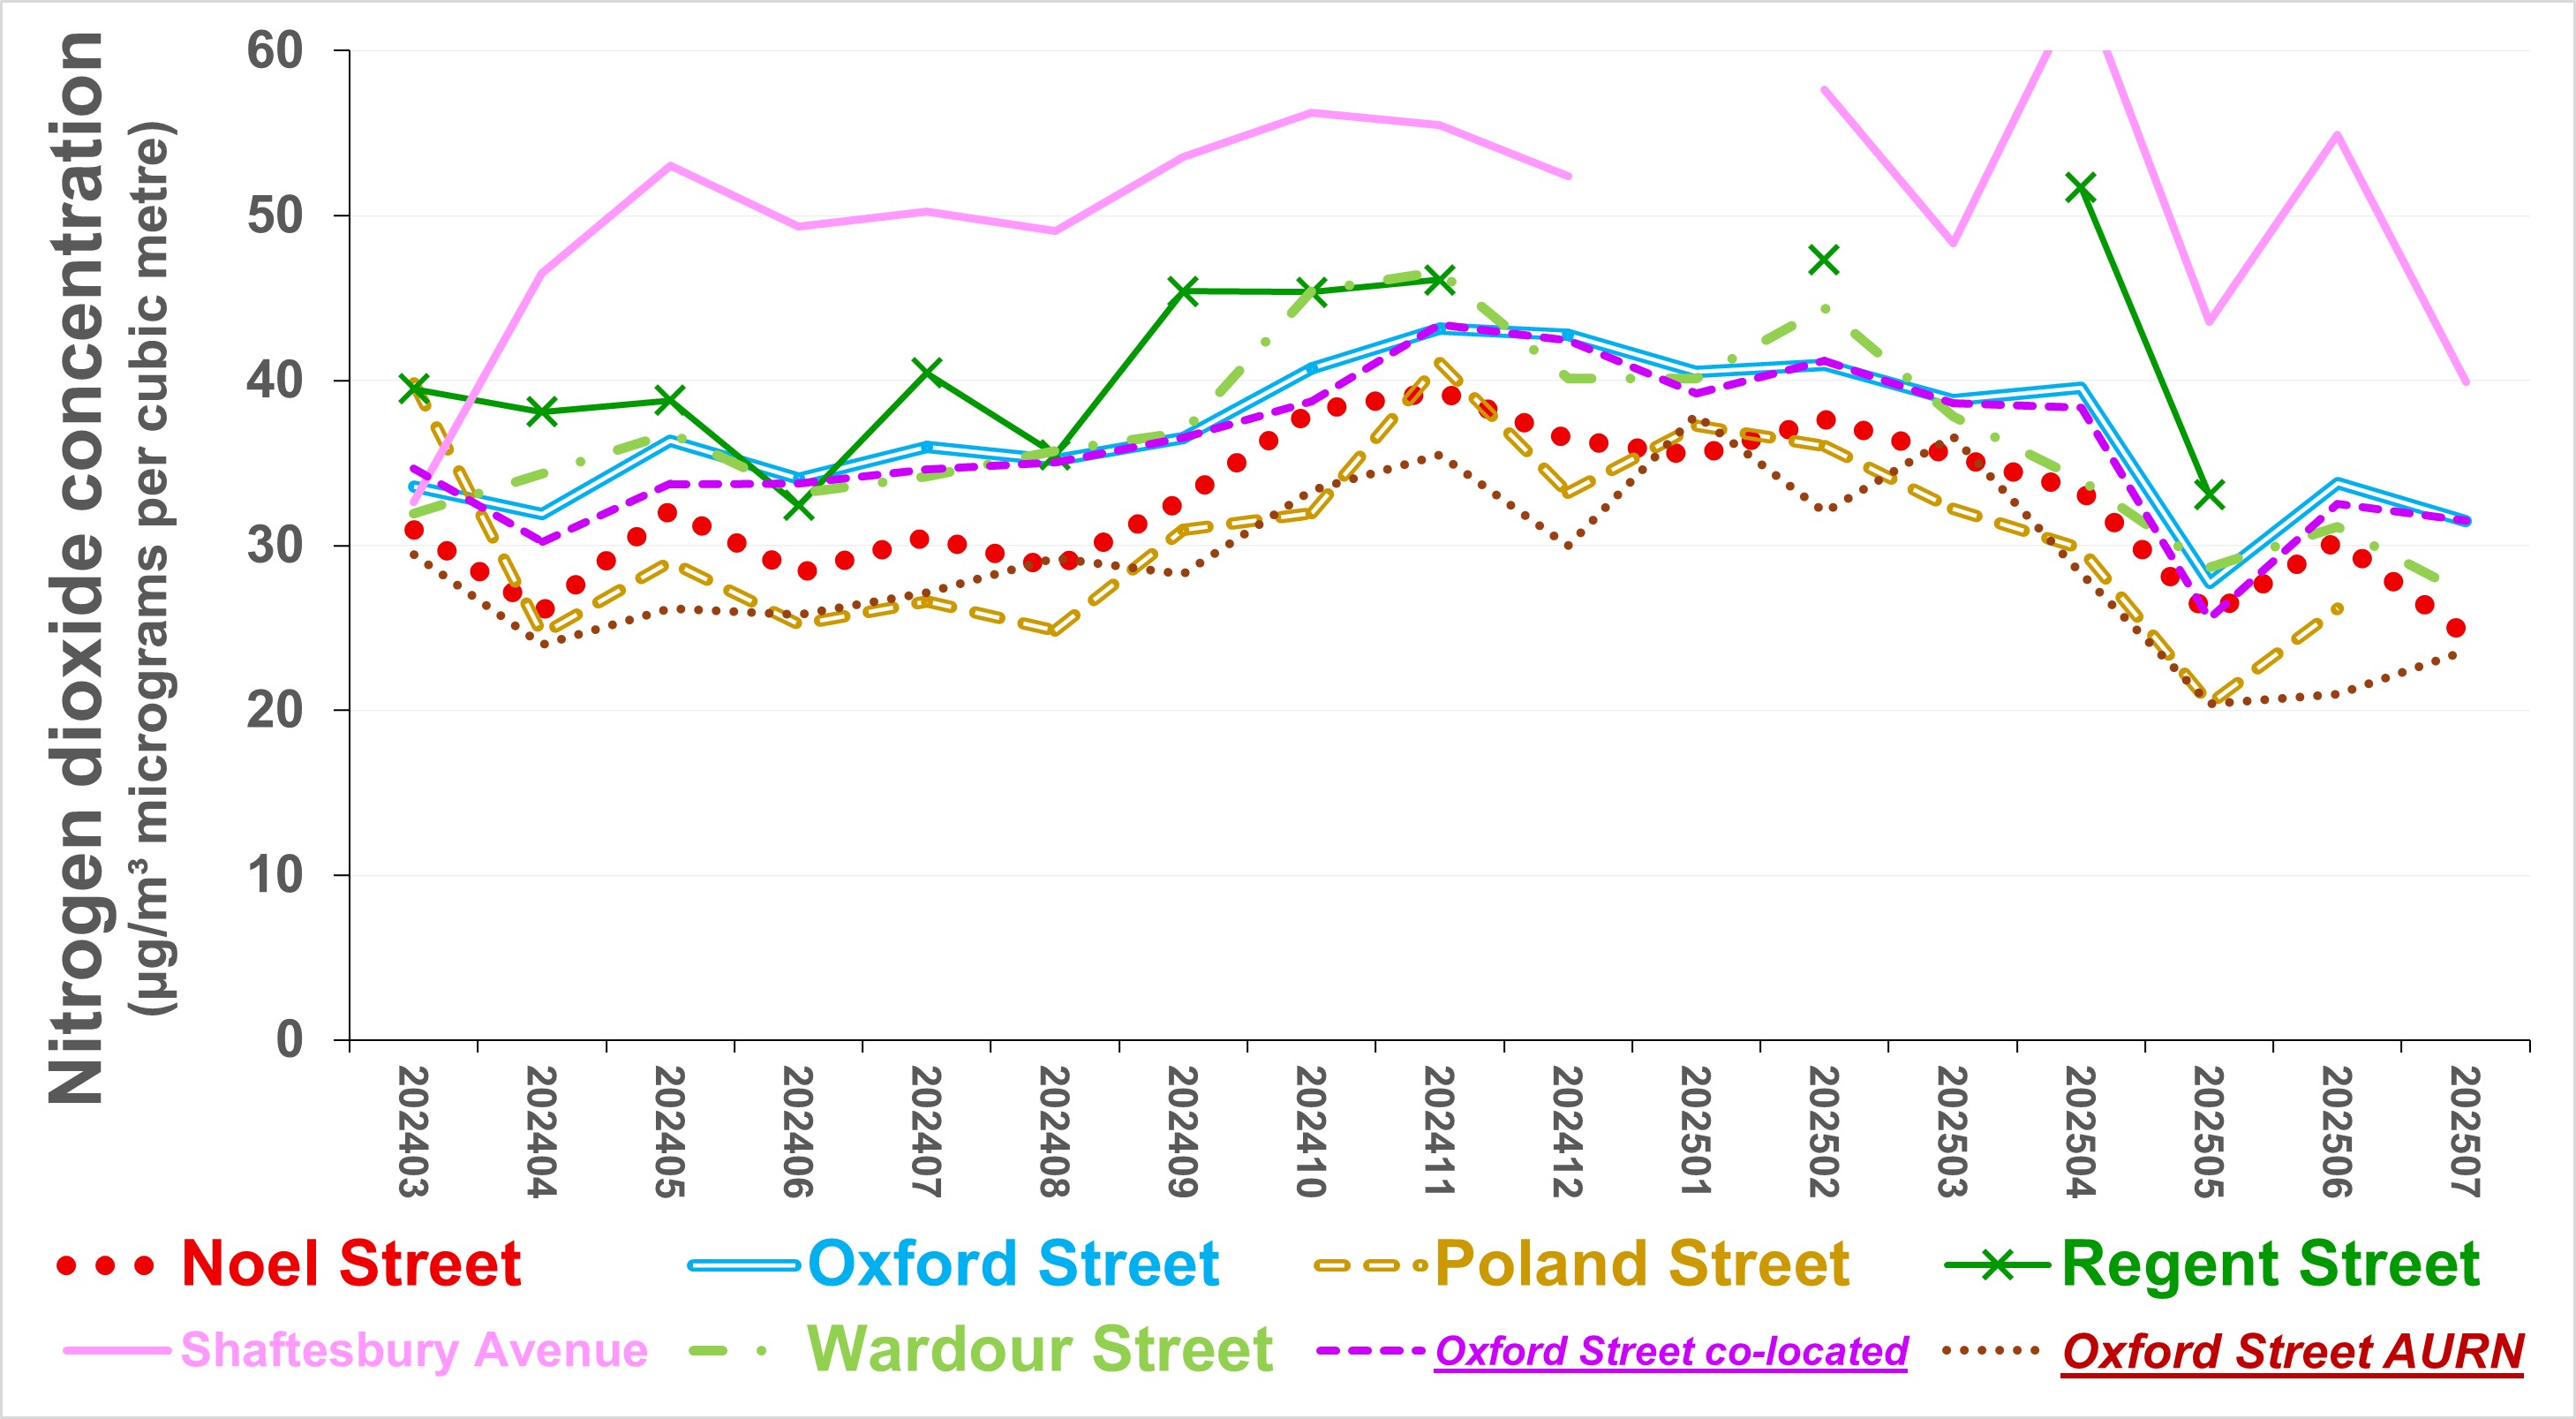
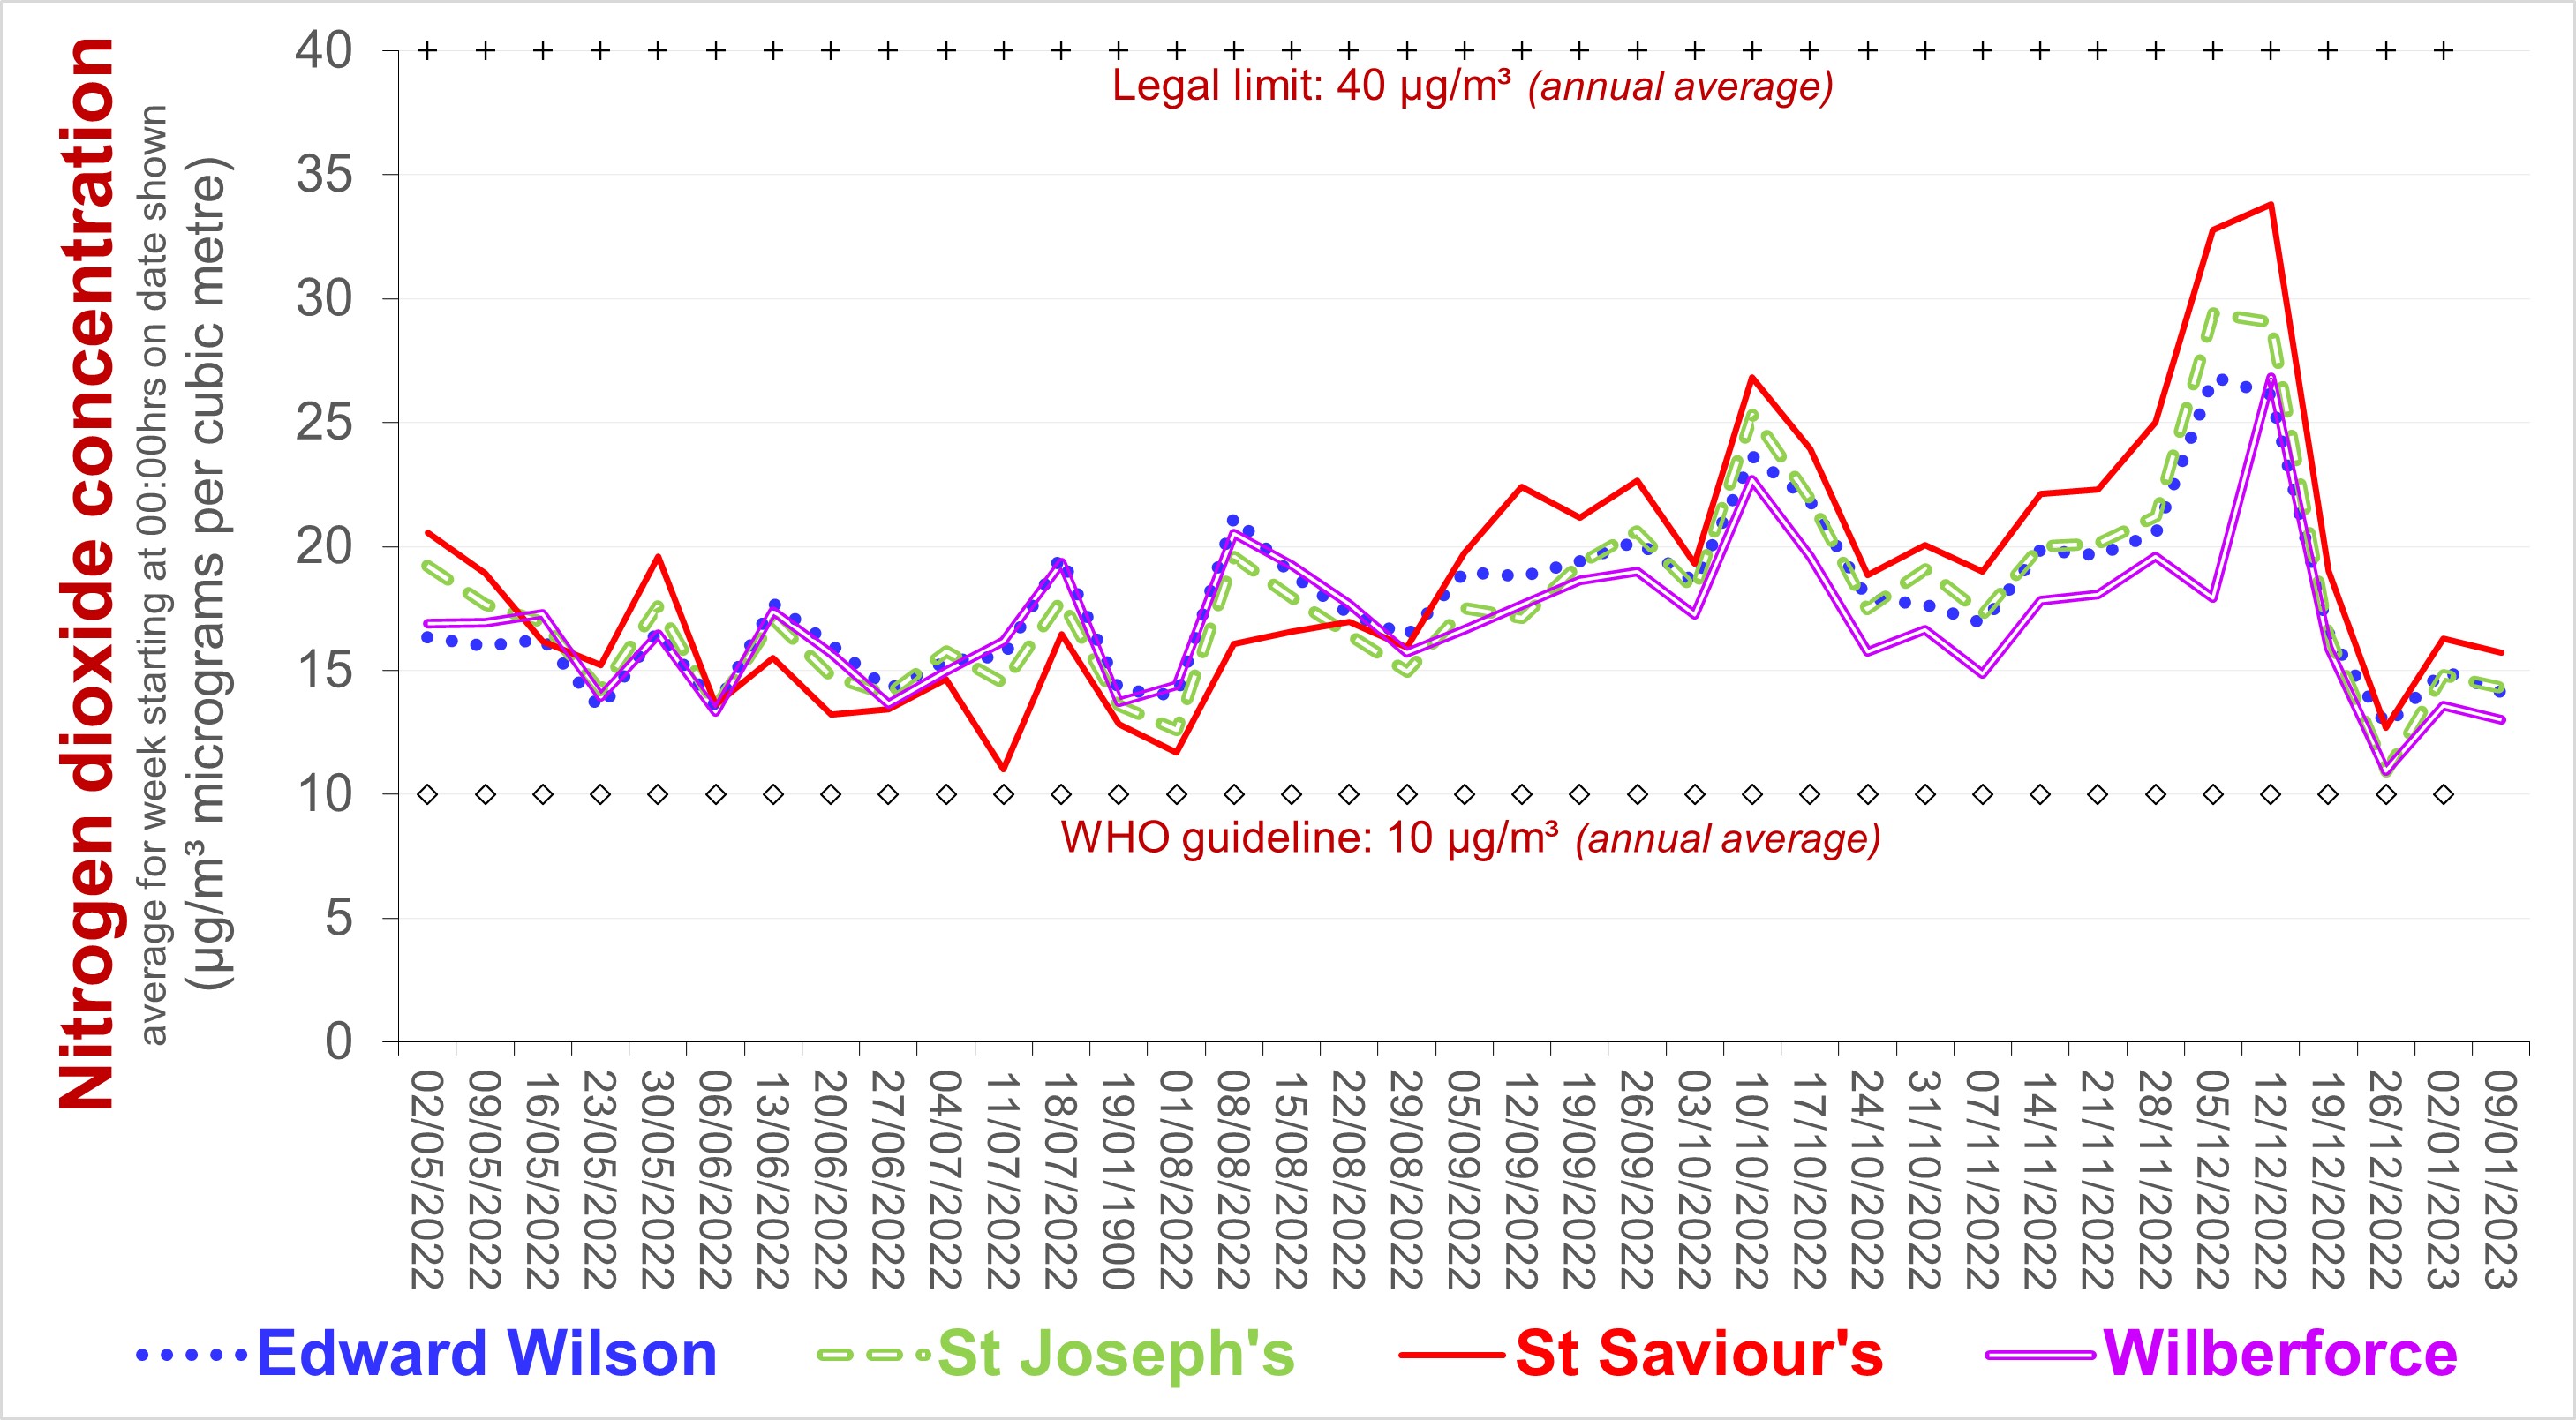
The following two charts illustrate monthly
NO2 concentrations across Soho.
The following chart derives from the public portal for
four schools
in Westminster
Click the chart for PM2.5 and ozone
The cold snap contributed to the December spike, the increase
in NO2 since summer reflects seasonal variation.
Click
here
for charts deriving from and air quality audit of schools
in Westminster
A
summary report
of the audits of air quality which the Council carried out for schools across Wesminster during 2019 and 2020
states
that NO2
concentrations adjacent more than half of those schools exceeded
the legal limit.
That report neither identified which those schools were nor
explained why, despite having authority over most roads adjacent
those schools, NO2 concentrations remain above the legal limit a
decade after they should have been below it. The Council's
subsequent
action includes making recommendations and offering up to £10,000 per school
- but not reducing the pollution at source, for example, from
traffic on roads managed by the Council. One school has been
allocated a budget of roughly £25,000 for air filters - with
no apparent provision for optimising their
location or monitoring their effectiveness. This adds to
the burden of the "innocent victim" and may serve to reduce pressure
to addres the problem.
Deploying diffusion tubes - and publishing measured data every
month - would, at minimal cost, help the
Council, residents and users guage the impact of specific
projects, such as during and after the costly, contentious urban
greening and road works of the the Marylebone Low Emission
Neighbourhood. Concerning the latter, the Council chose not
to do so - monitoring was presumably a condition of the one million
UK£ GLA grant it received for the project.
Court rulings subsequent to cases
brought by ClientEarth oblige government to ensure NO2
concentrations decline to beneath the legal limit in the shortest
possible time. During September 2021, based on 16 years of
evidence and research, the World Health Organisation
revised its advice concerning the maximum annual average
concentration of NO2
and particulate matter PM2.5 - respectively, they are now four and
five times less than the legal limit. Central government has passed the buck to local
councils, obliging them to demonstrate that they are doing all
they can within their power to comply.
It would
obviously be wrong to assume that local councils have sufficient
power to design and implement policies which meet that legal
obligation, especially in London where regional government might
have much greater influence. That said, the Council has now
declared a
Climate Emergency (but its more recent City Plan 2019-2040
almost completely ignores this, thereby almost inviting
litigation). The Westminster Climate Emergency Action Plan seeks
to achieve no more than half of the emissions reduction between
business as usual and what the Tyndal Centre urges by 2040 [page
15].
Research by Imperial College
[see
/ listen from minute 15:10]
indicates that NO2 concentrations are unlikely to meet that
requirement, particularly along those busy streets (and in their
neighbourhood), even when the proposed Ultra Low Emission Zone is
fully implemented across London. A substantial reduction in
vehicle numbers will be essential. Indeed, until the battery
charging network for electric vehicles ceases to rely on
electricity generated by burning fossil fuel or biomass, those
vehicles will tend to accelarate climate change.
|
|
For further information, please contact: info@airqualitymatters.uk |
| Back |