|
AIR QUALITY MATTERS |
|
Breathe London data for Westminster |
|
|
|
The charts presented here derive from hourly data continuously measured by sensors under the seond phase of Breathe London. There is a lack of information drawing conclusions from the first, pilot phase. Nitrogen dioxide NO2 and particulate matter PM2.5 concentrations measured during that first phase are available from here (but might not have been ratified). In both phases, data generated by the sensors is indicative - not reference quality.
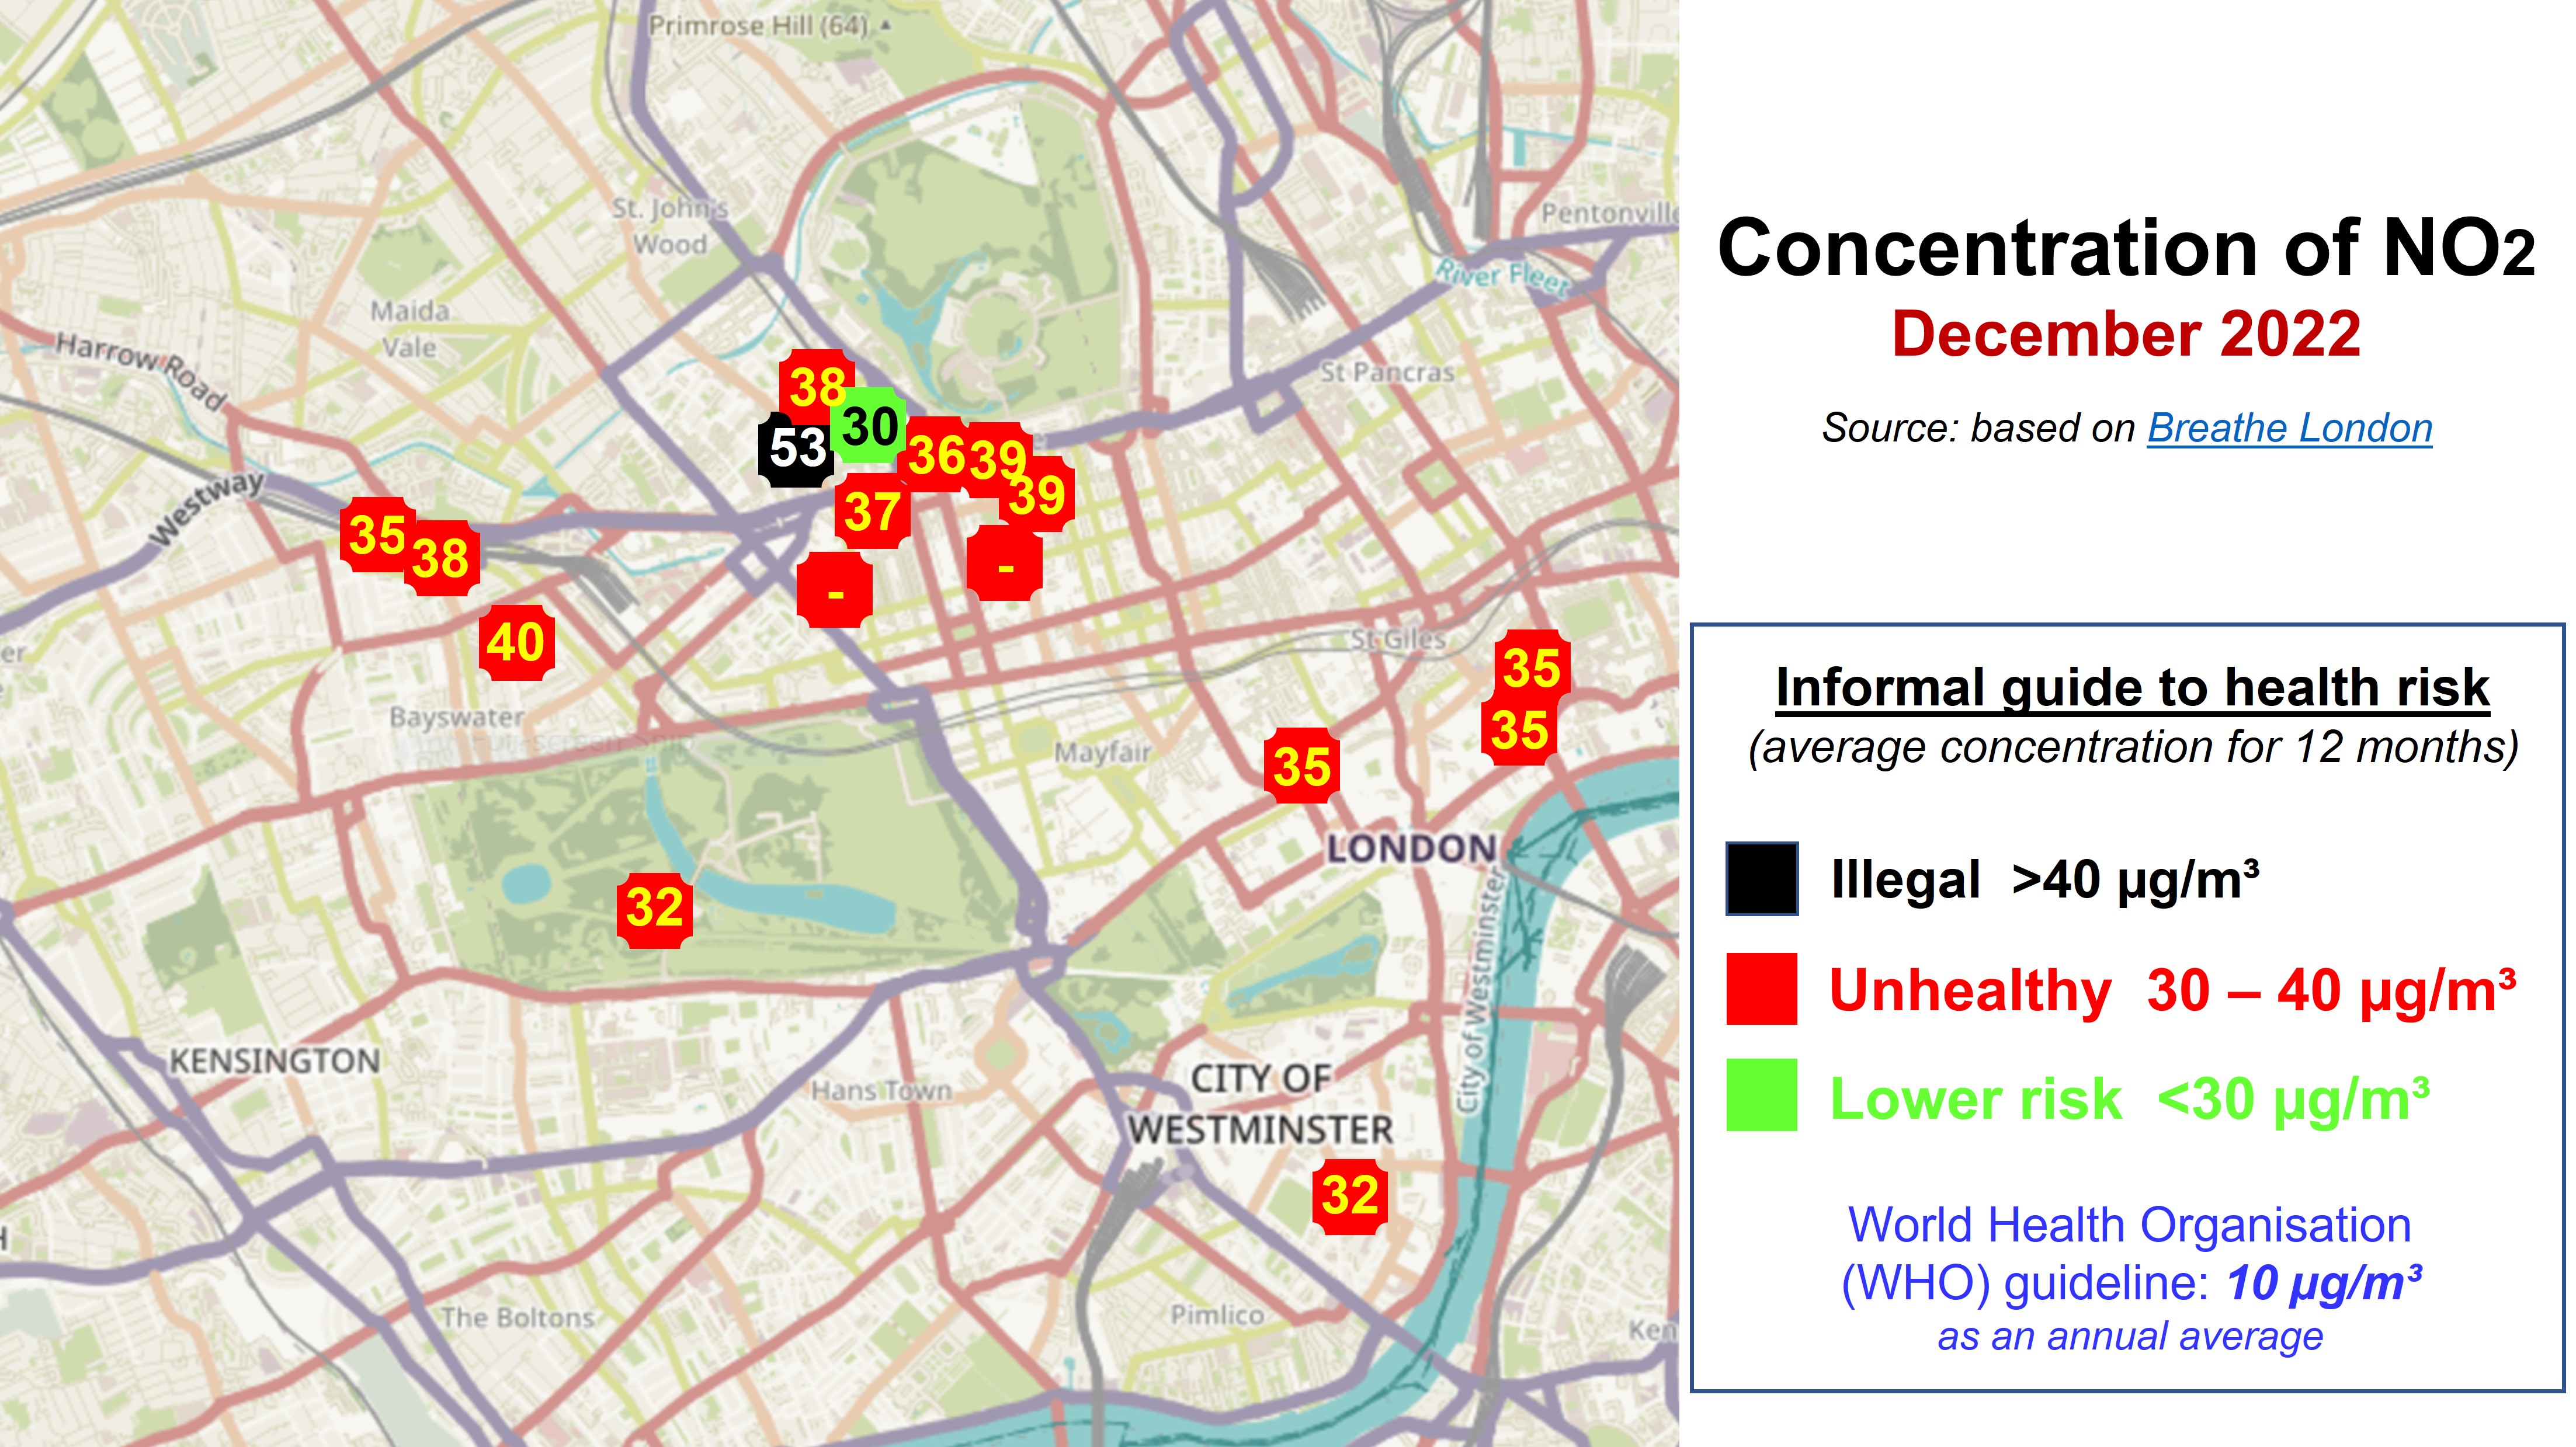
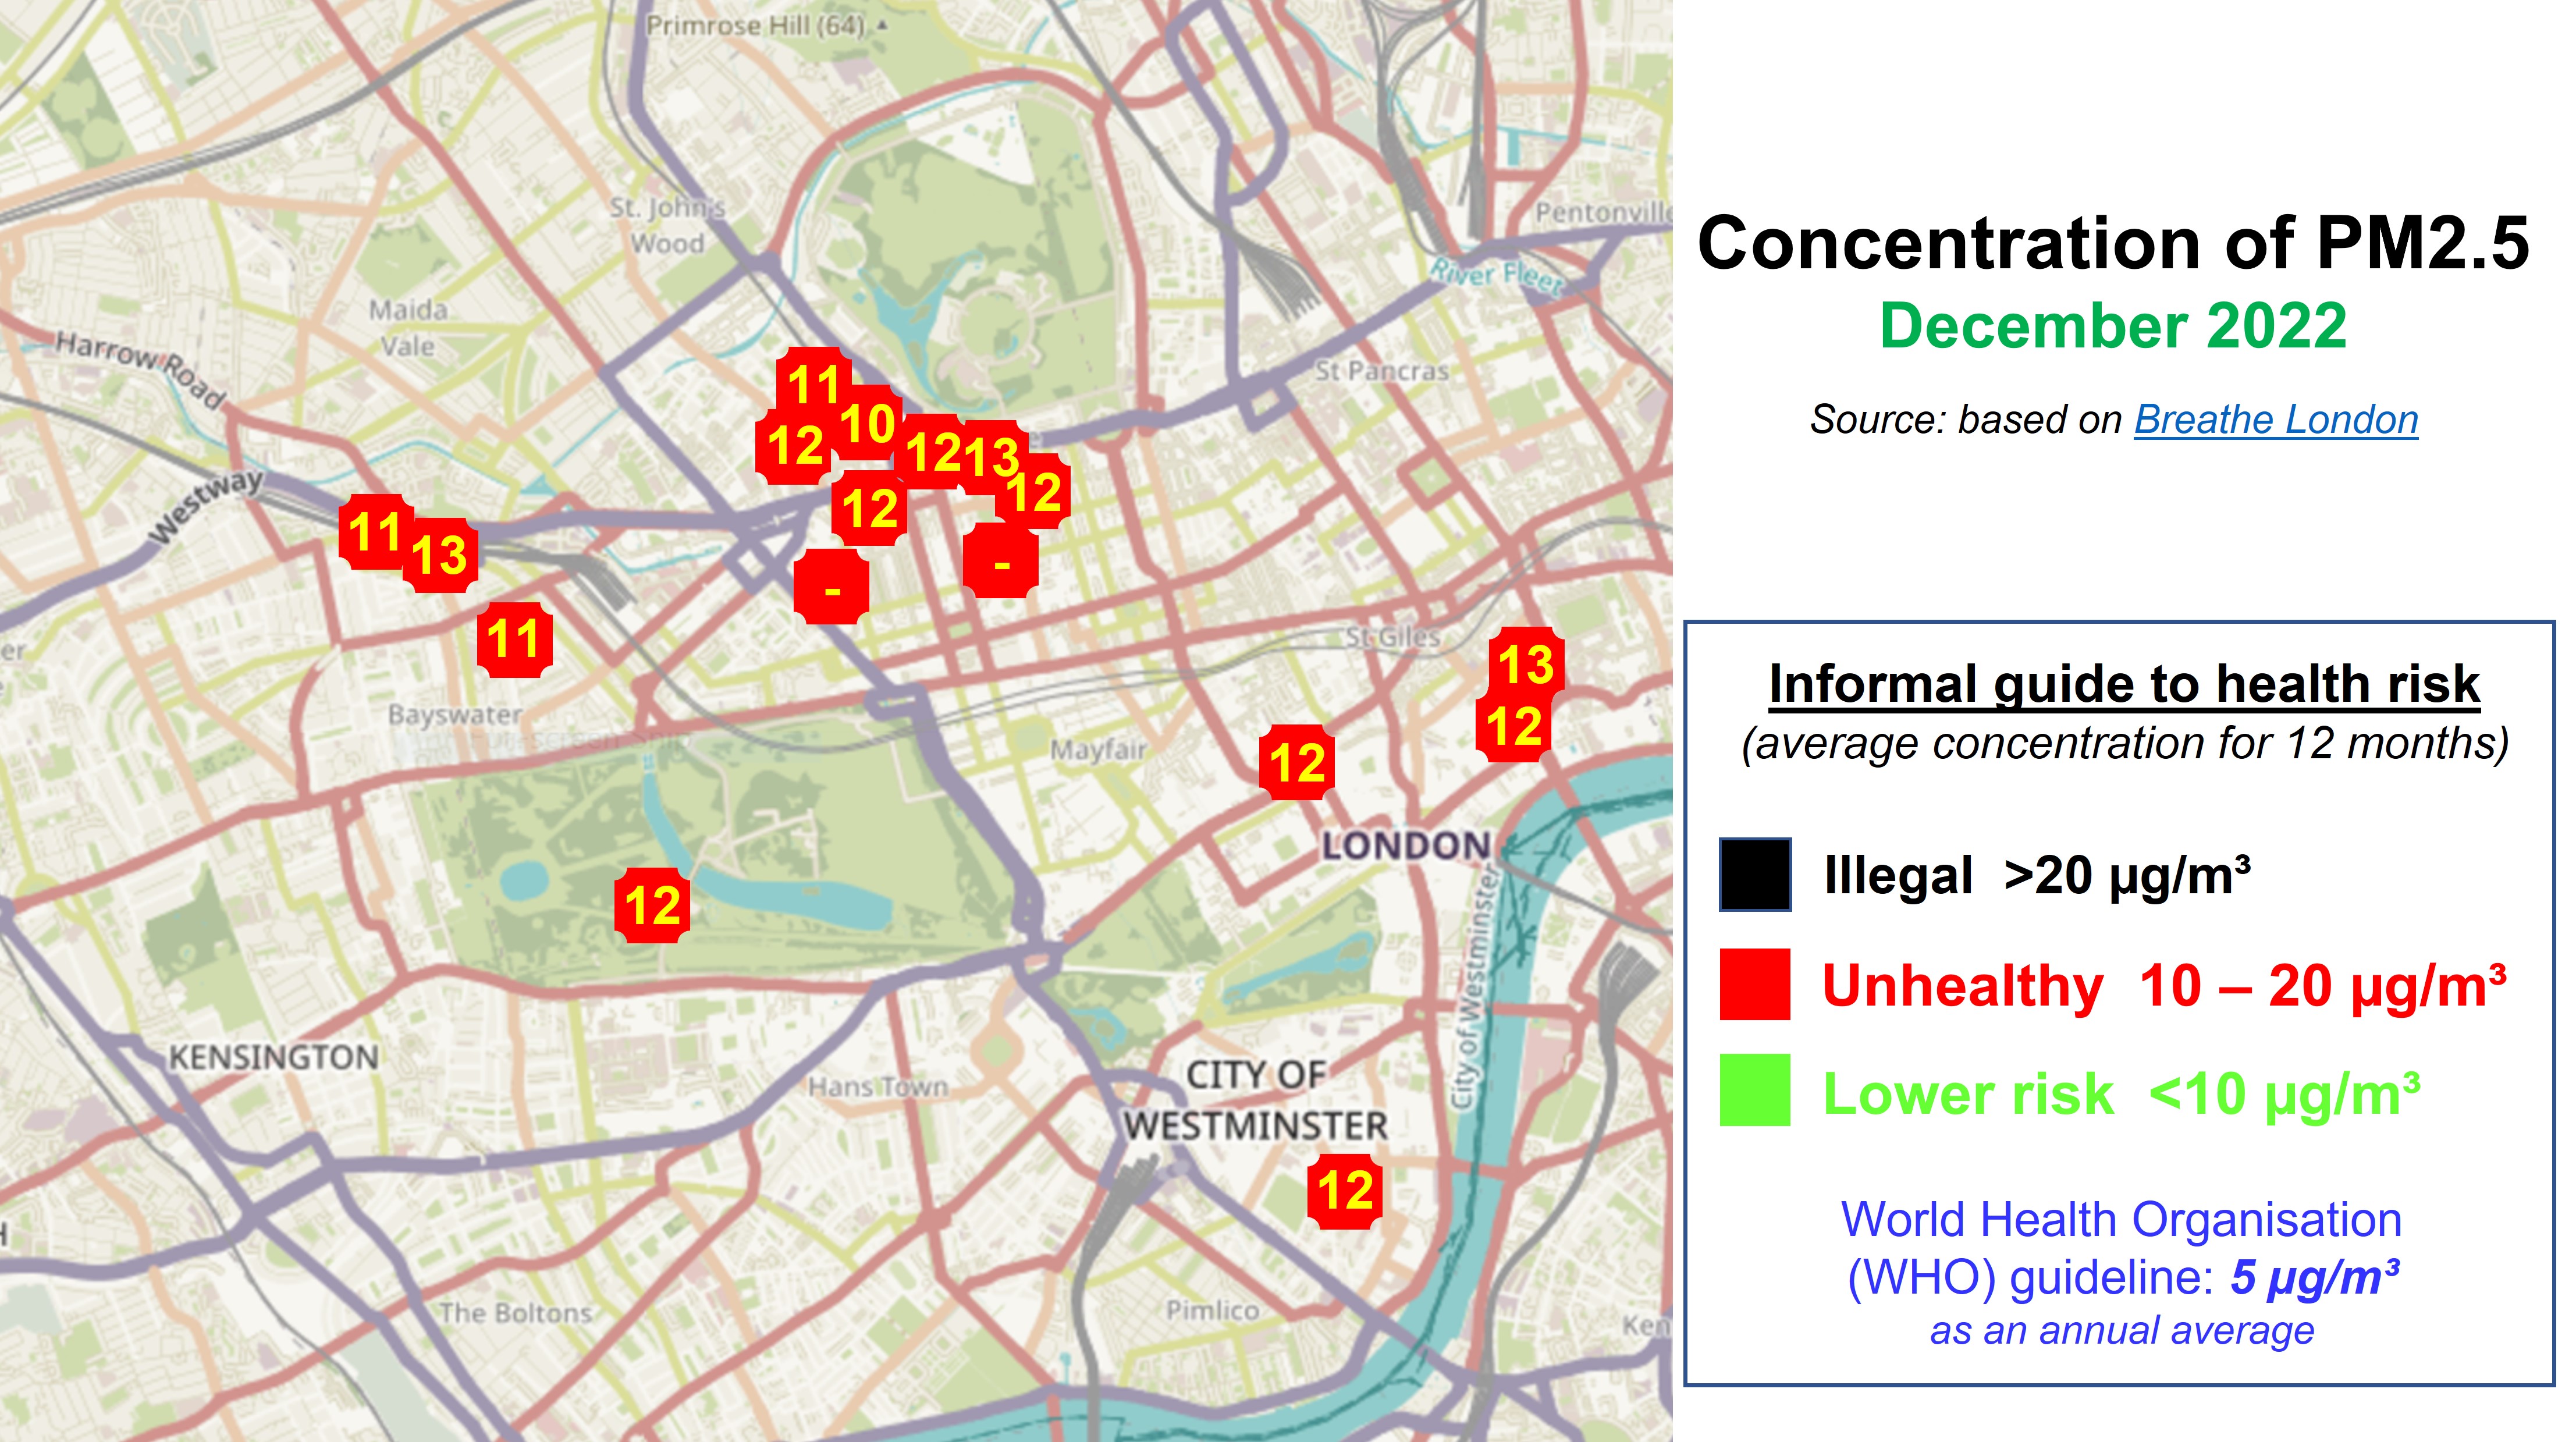
Click the map below to obtain mapped data for previous months.
Click the map below to obtain mapped data for previous months.
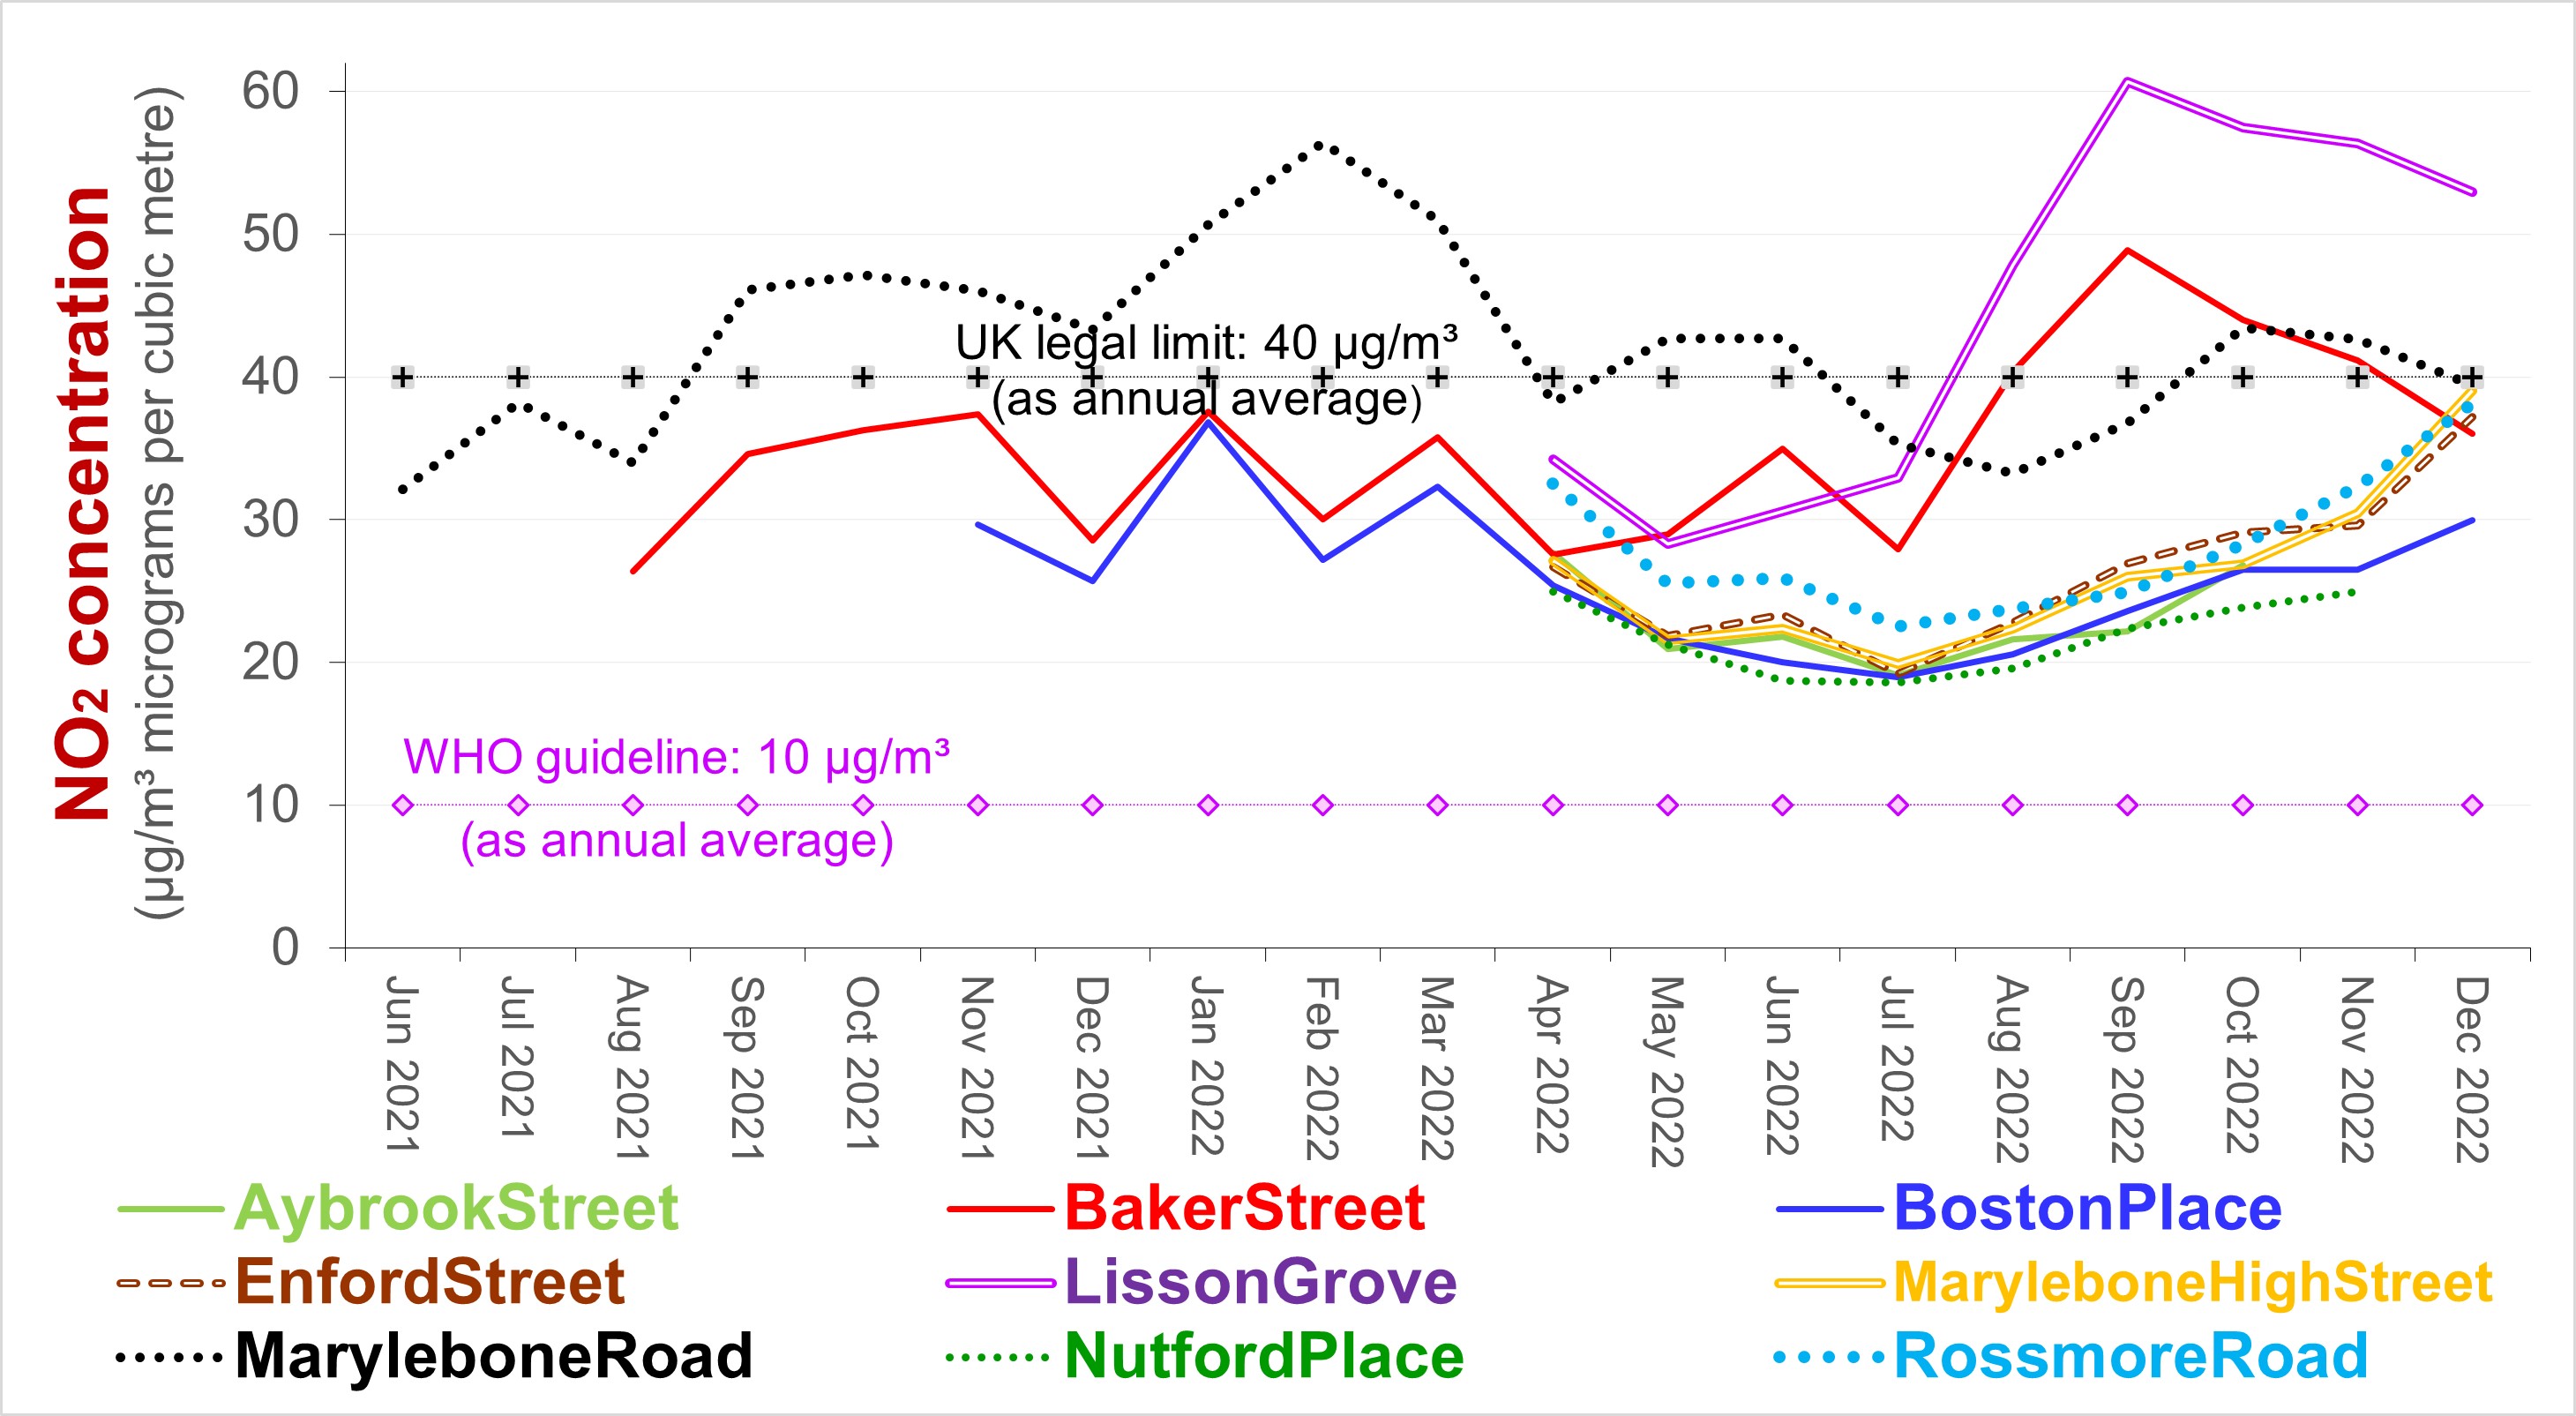
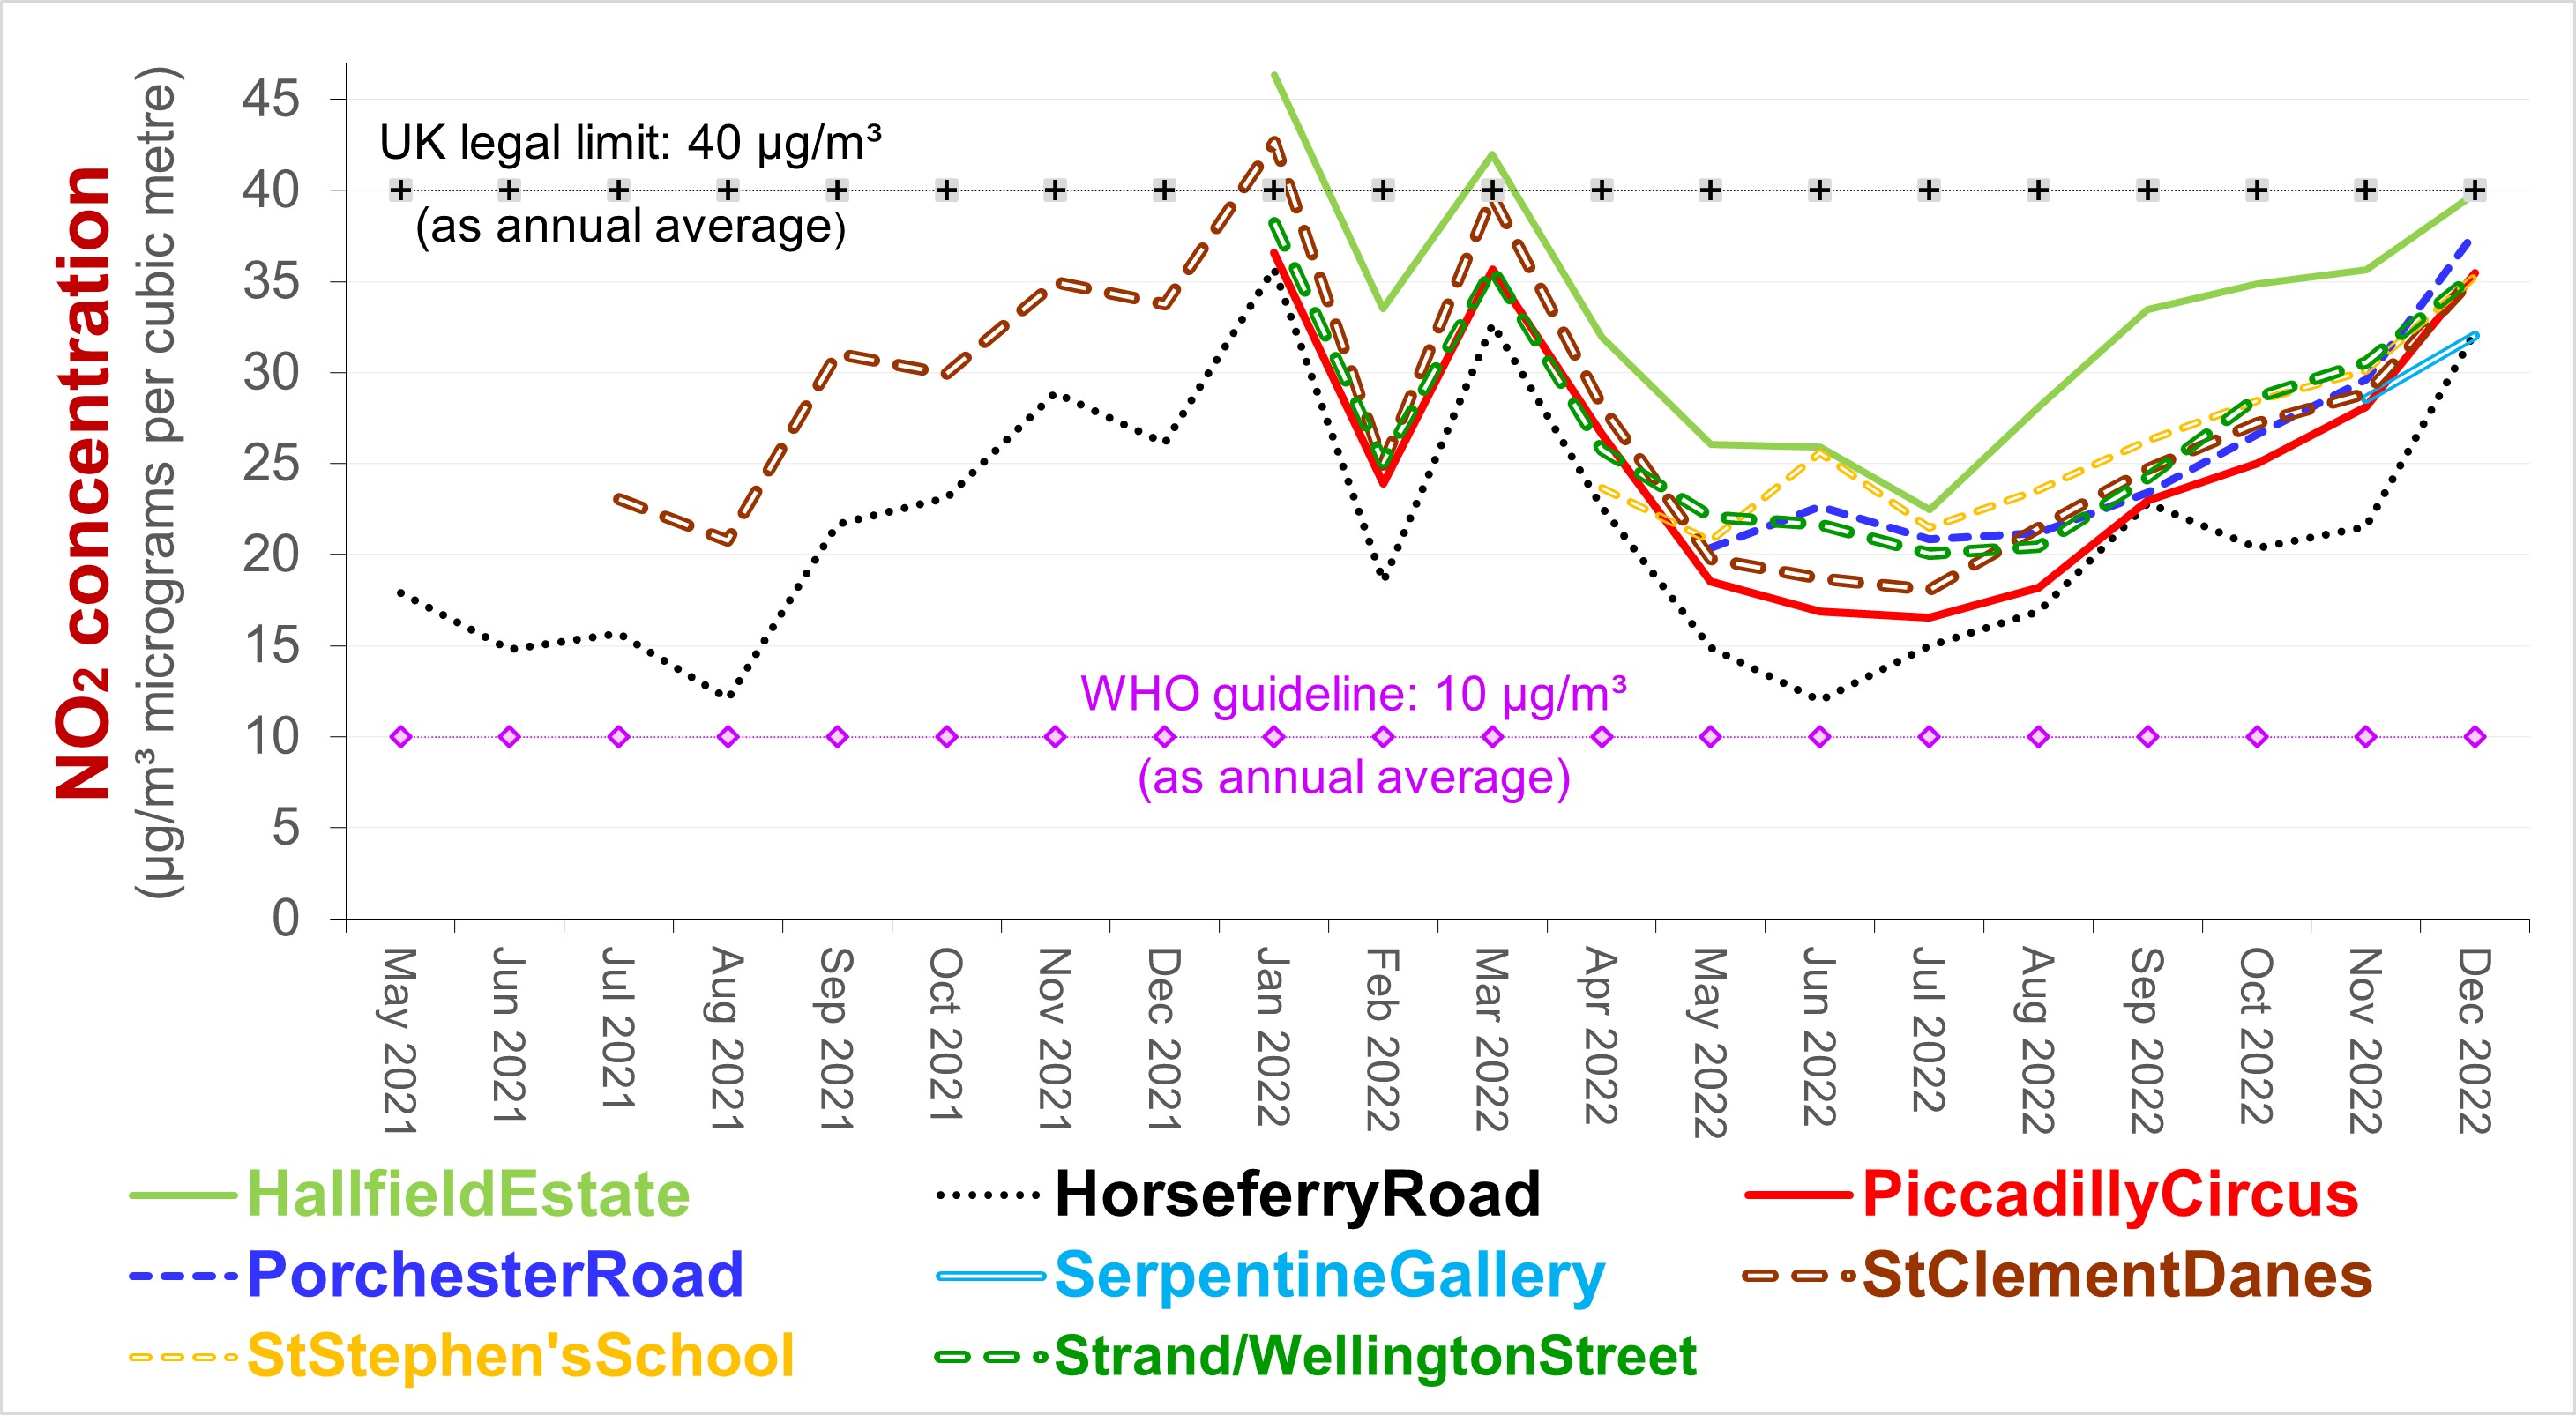
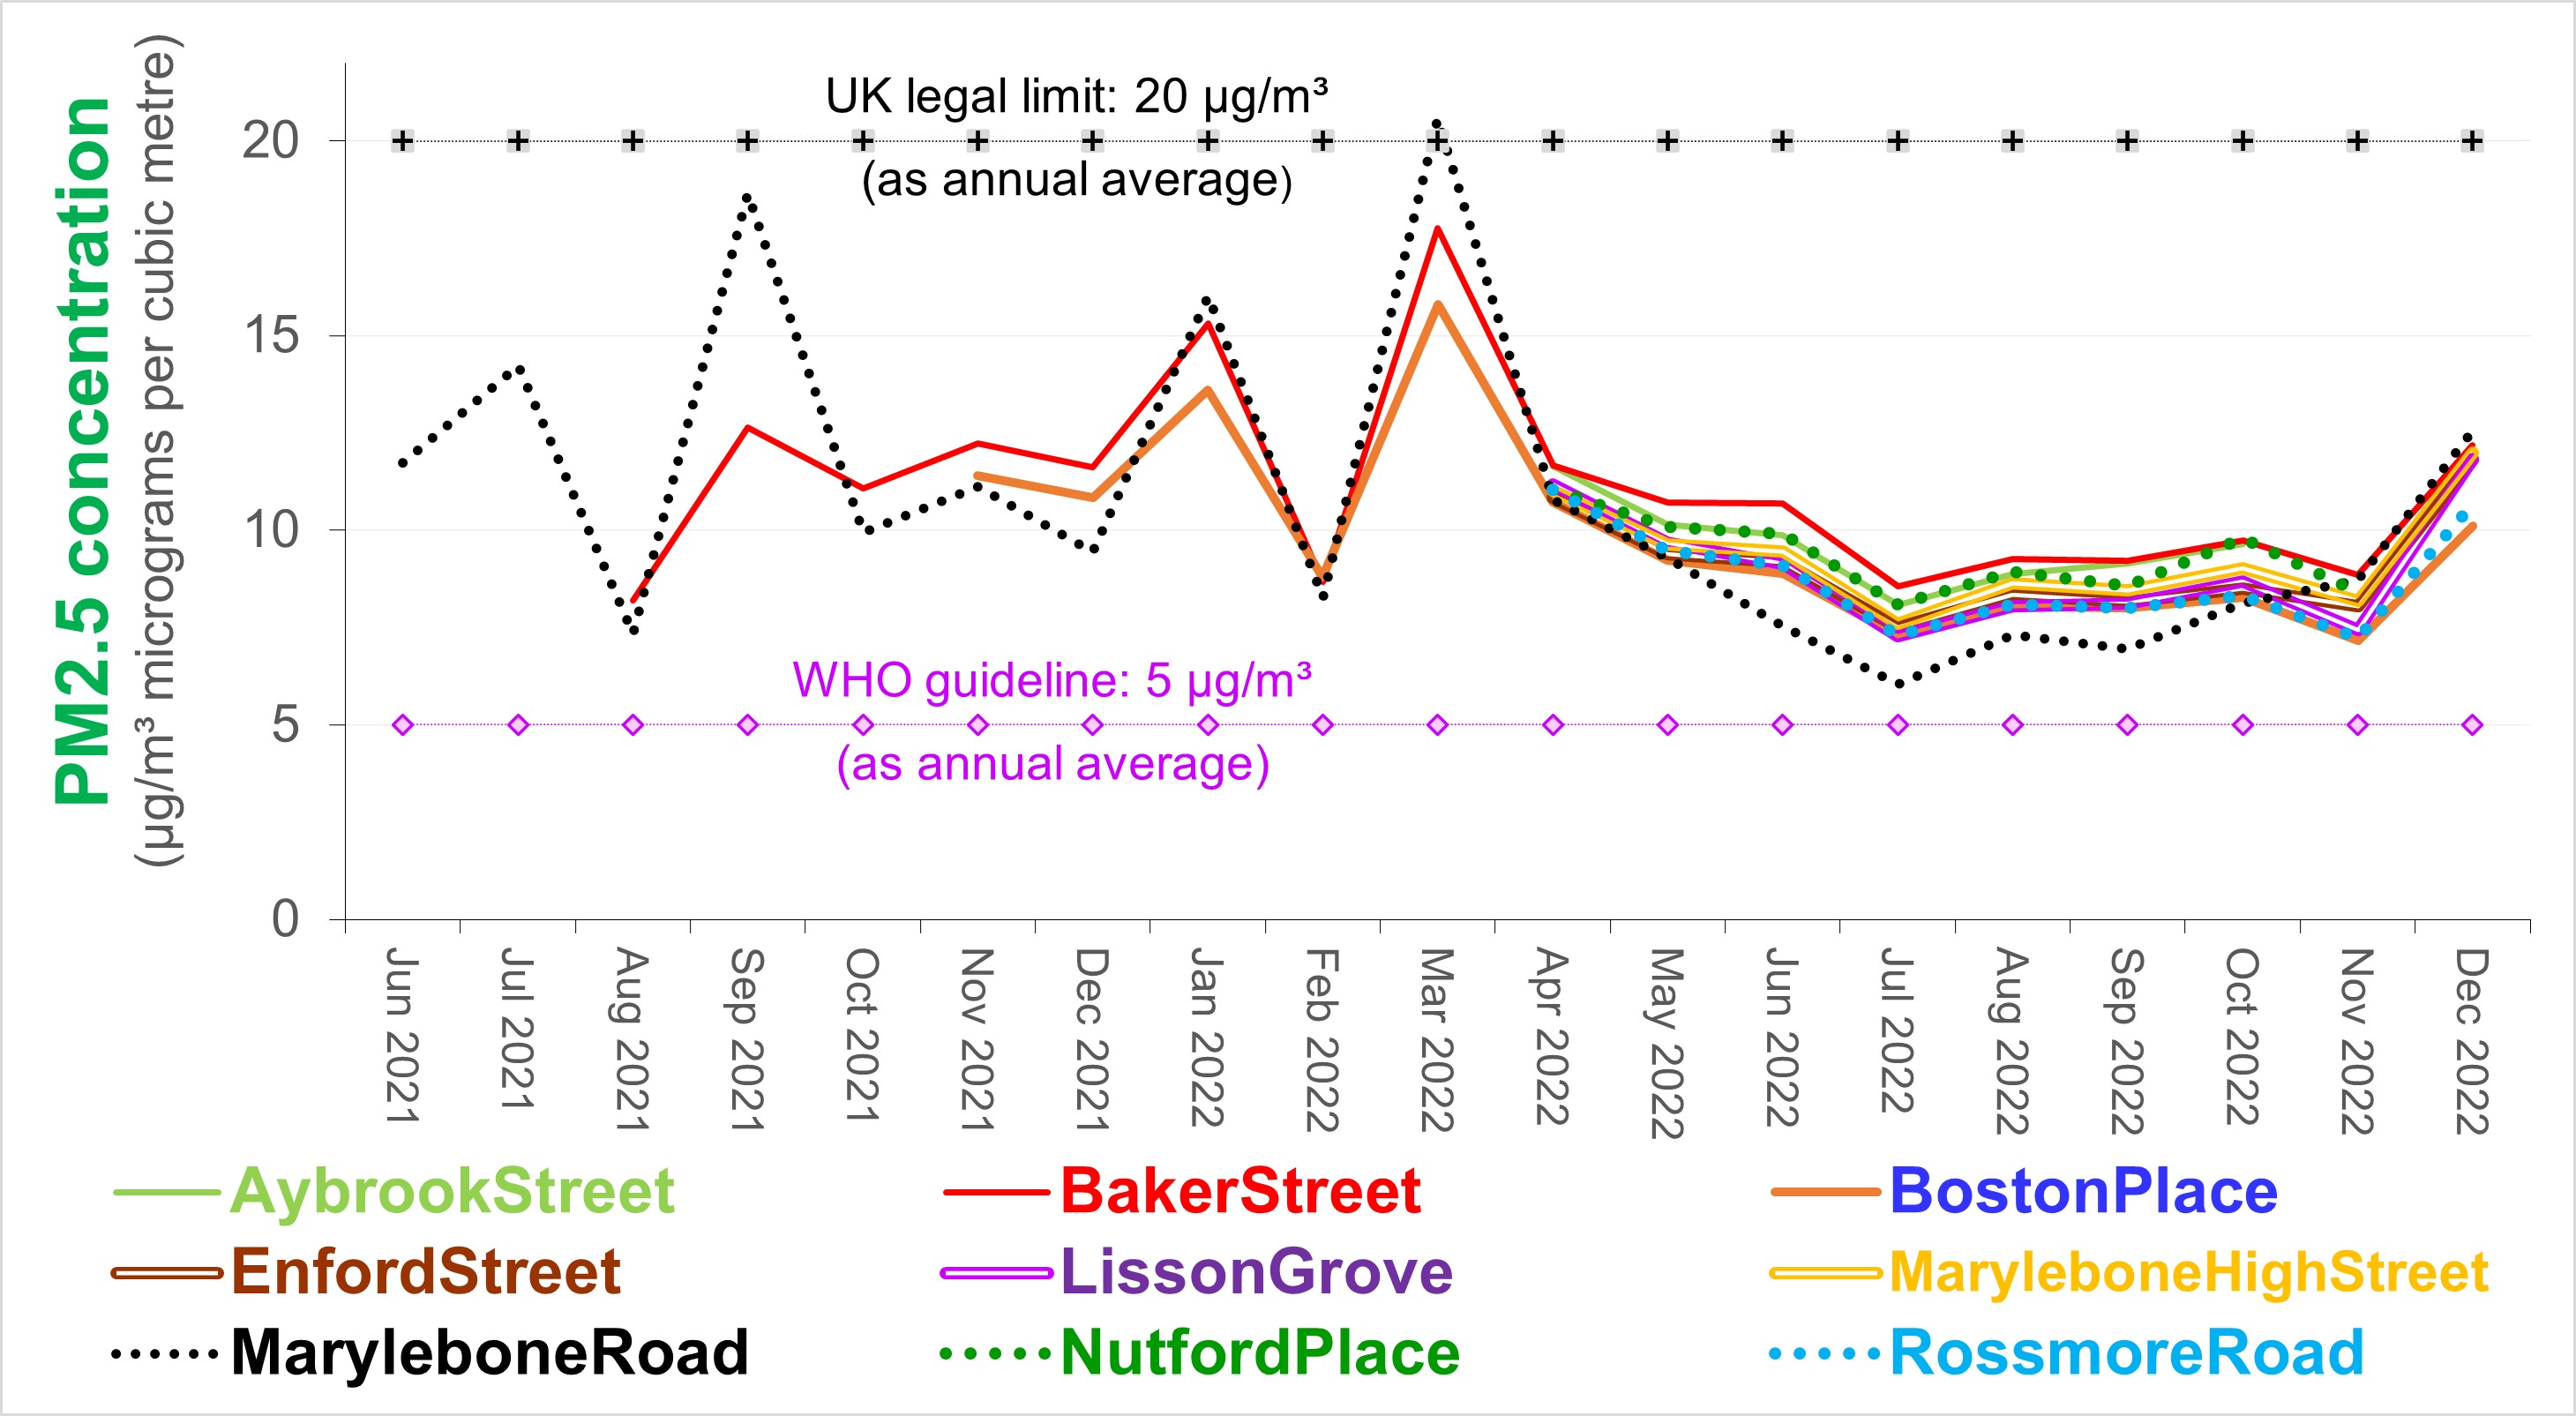
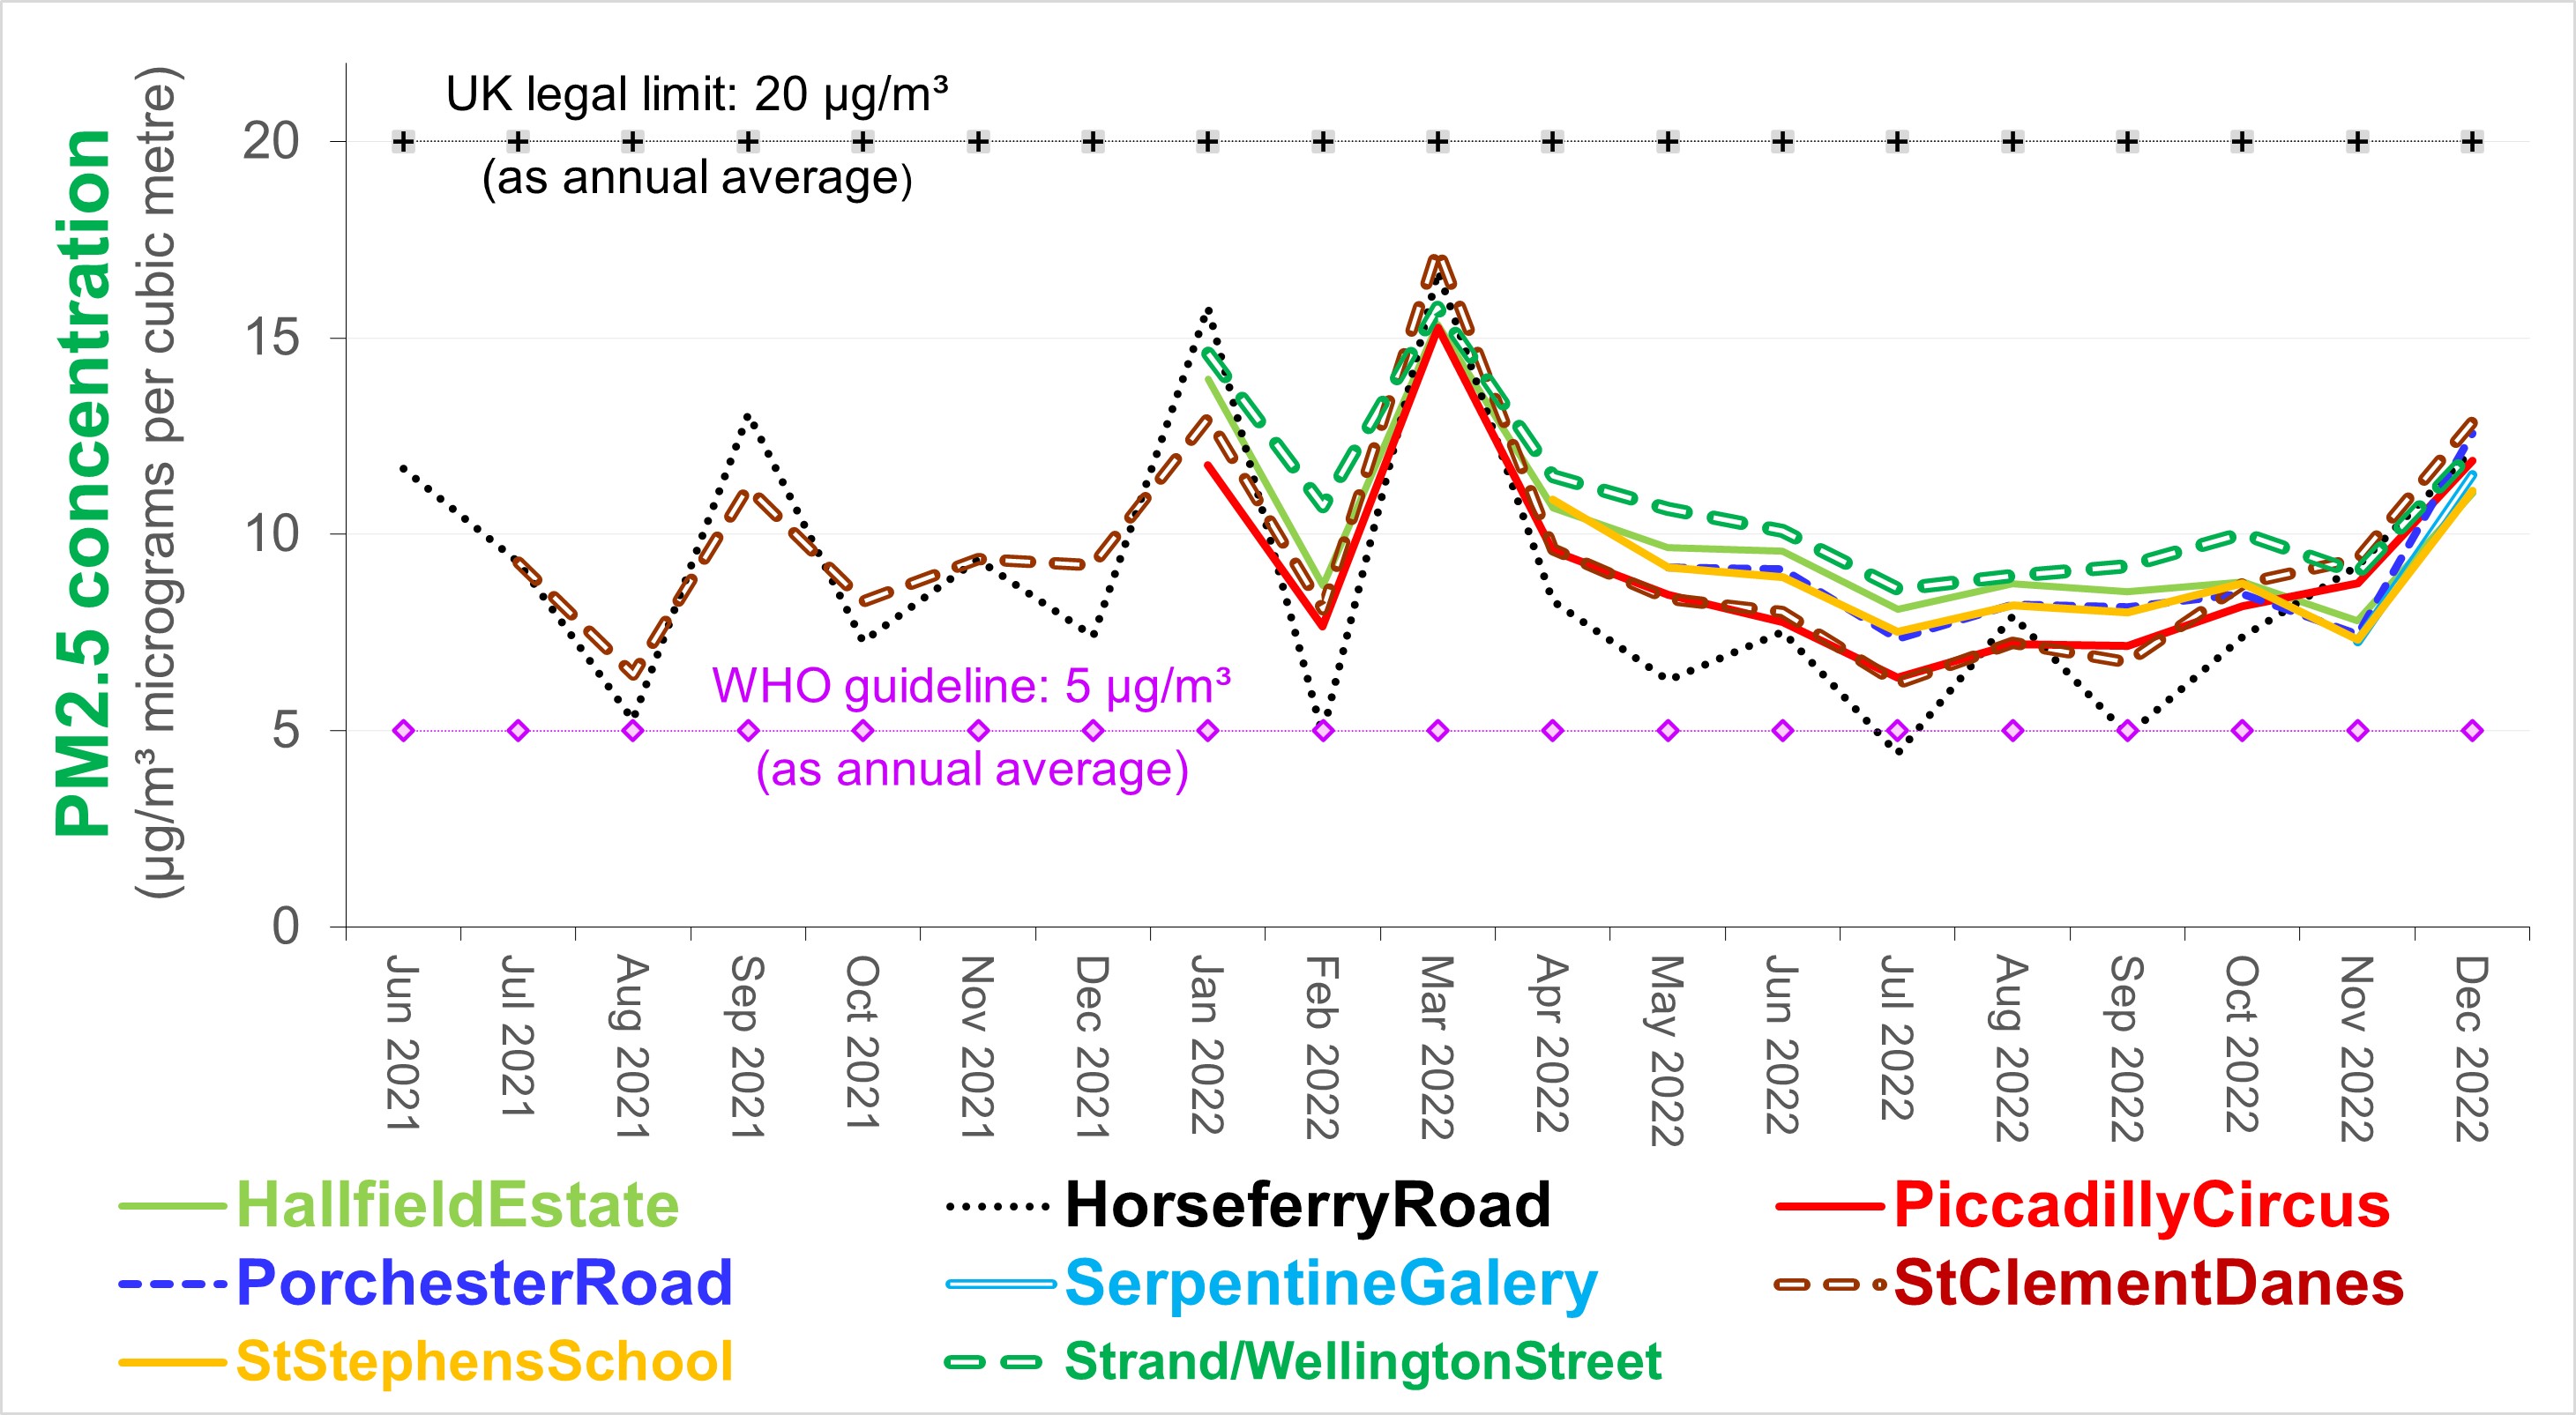
The following two charts illustrate trends in monthly
concentrations of NO2
The following two charts illustrate trends in monthly
concentrations PM2.5
|
|
For further information, please contact: info@airqualitymatters.uk |
| Back |